
 Available in US
Content
- Three Odds Formats, One Underlying Probability
- Decimal Odds: The UK Standard for Hockey
- Fractional Odds in Hockey Betting
- American (Moneyline) Odds: Reading NHL Lines from US Sources
- Converting Between Formats: The Maths
- Implied Probability and Overround
- Hockey-Specific Odds: Puck Line, Totals, and Three-Way Prices
- Odds Shopping Across UK Bookmakers: Worked Example
- Hockey Odds Questions
Three Odds Formats, One Underlying Probability
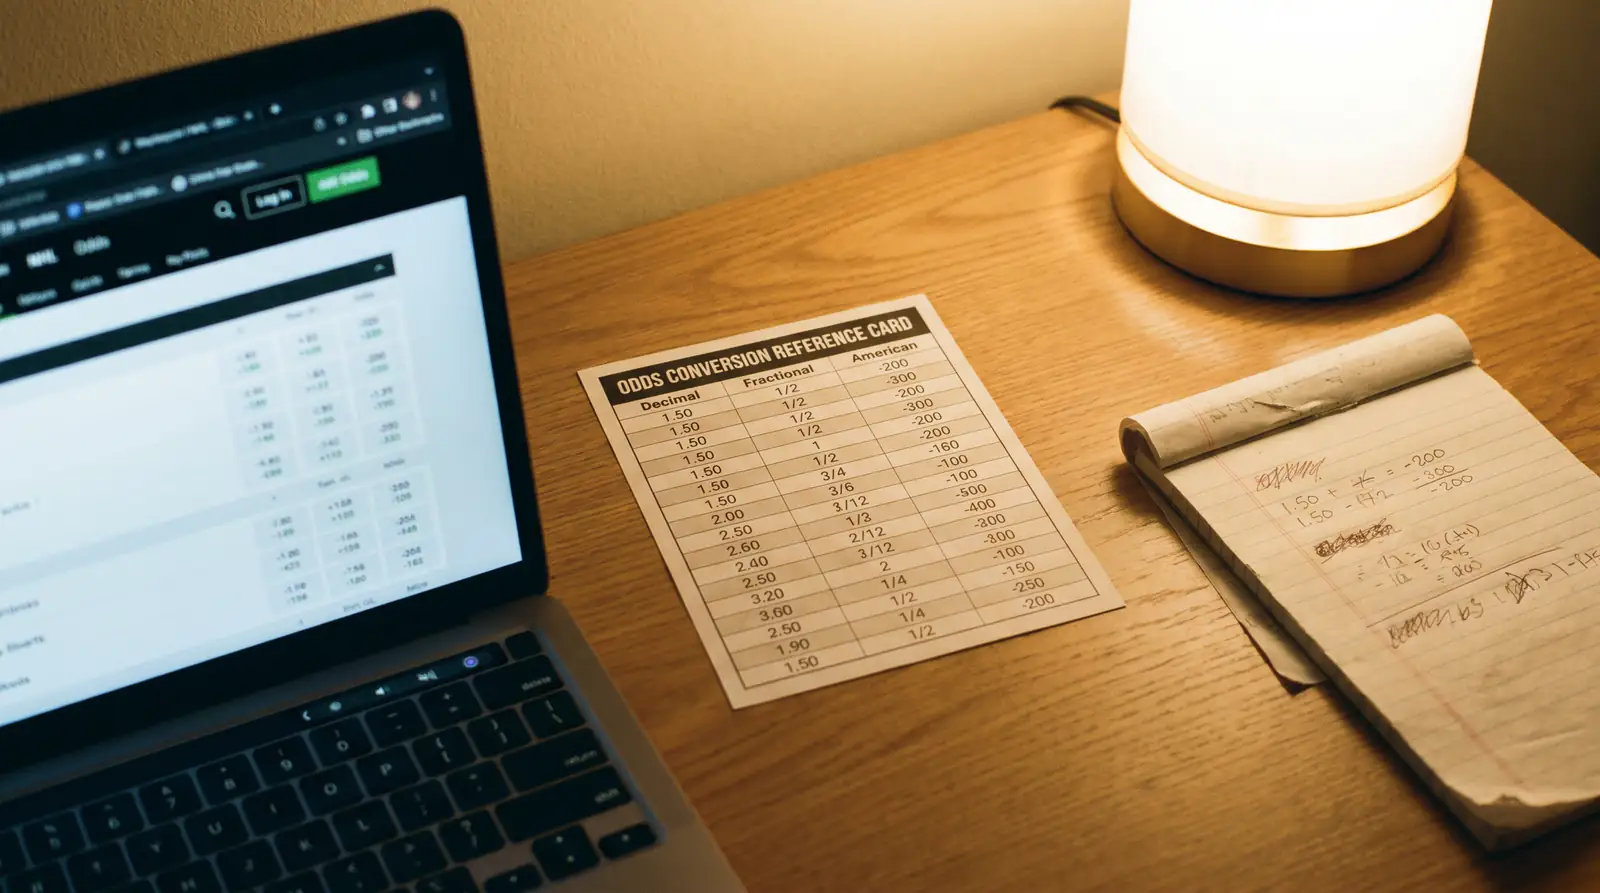
The first time I compared NHL odds across a UK bookmaker, an American sportsbook, and a European exchange, I was looking at three completely different numbers for the same outcome. One said 2.40. Another said 7/5. A third said +140. It took me ten minutes and a calculator to confirm they all meant the same thing. That confusion cost me nothing — but it could have cost me a bad bet if I had misread a price in a rush.
The global sports betting market was valued at $111.9 billion in 2025 and is forecast to nearly double by 2034. Europe holds over 40% of that market. The sheer scale means odds are displayed in multiple formats depending on where the operator is based, and hockey bettors encounter all three more frequently than most because the NHL is a North American league priced primarily in American odds but consumed by UK punters who think in decimals.
This article teaches you to read, convert, and use every odds format you will encounter. By the end, you will be able to glance at a line from any source — a UK bookmaker, an American tipster, a Canadian data feed — and instantly understand what it means for your bet.
Decimal Odds: The UK Standard for Hockey
Decimal odds are the default at every major UK bookmaker, and for good reason: they are the most intuitive format for calculating returns. The number you see is the total payout per pound staked, including your original stake. If the odds are 2.40, a 10-pound bet returns 24 pounds — 14 pounds in profit plus your 10-pound stake back.
The calculation is always the same: stake multiplied by decimal odds equals total return. Subtract your stake to find the profit. A 10-pound bet at 1.50 returns 15 pounds (5 profit). A 10-pound bet at 3.25 returns 32.50 pounds (22.50 profit). No fractions, no positive-negative signs, no confusion about whether the number includes your stake or not. Decimal odds always include it.
The range of decimal odds you will see in hockey is narrower than in many other sports. Heavy NHL favourites rarely go below 1.30, and extreme underdogs rarely exceed 4.50 on the moneyline. Most games cluster between 1.50 and 2.50 for each team, reflecting hockey’s competitive balance. When you see a price outside that range, the game likely involves a significant talent gap — a bottom-five team hosting a genuine contender, or a playoff game where one side has a dominant historical record in the matchup.
One nuance that catches beginners: decimal odds of exactly 2.00 represent an even-money bet, meaning the bookmaker’s implied probability is exactly 50%. In practice, you will almost never see both teams priced at 2.00 in a hockey game because the bookmaker’s margin pushes both prices below 2.00 or distributes the gap asymmetrically. If you see a team at 2.00, the bookmaker considers the game very close to a coin flip — and those games often offer interesting betting opportunities because small edges become meaningful at even-money prices.
I recommend keeping your bookmaker account set to decimal odds permanently, even if you grew up with fractional prices. The ease of mental arithmetic — “2.40 means I get 2.4 times my stake” — is unmatched, and it makes comparing prices across operators instant. Every other format requires an extra conversion step that slows you down.

Fractional Odds in Hockey Betting
Walk into any betting shop on a British high street and the odds board shows fractional prices. They are embedded in UK betting culture — “5/1 on the outsider” is a phrase everyone understands even if they have never placed a bet. But fractional odds are clunkier for hockey than decimals, and I stopped using them for ice hockey within my first season.
Fractional odds express the profit relative to the stake, not the total return. Odds of 7/5 mean you win 7 pounds for every 5 pounds staked — your profit is 7, and your total return is 12 (profit plus stake). Odds of 1/2 mean you win 1 pound for every 2 staked — a profit of 1, total return of 3. The mental arithmetic is manageable for simple fractions but becomes awkward with the precise pricing hockey requires. When a bookmaker prices a team at 13/8 or 11/10, you are reaching for a calculator or converting to decimal on instinct.
The conversion from fractional to decimal is straightforward: divide the first number by the second and add 1. So 7/5 becomes (7 divided by 5) + 1 = 2.40 in decimal. And 1/2 becomes (1 divided by 2) + 1 = 1.50. Going the other direction, subtract 1 from the decimal odds and express the result as a fraction: 2.40 minus 1 = 1.40, which simplifies to 7/5.
Fractional odds are still useful for one purpose: quick mental estimates of probability. Odds of “evens” (1/1) mean roughly 50%. Odds of 2/1 mean roughly 33%. Odds of 1/3 mean roughly 75%. These rough estimates let you assess a price at a glance without doing any arithmetic. But for precise betting decisions — comparing two prices, calculating expected value, or measuring overround — decimal is superior, and every UK bookmaker lets you toggle between formats with a single click.

American (Moneyline) Odds: Reading NHL Lines from US Sources
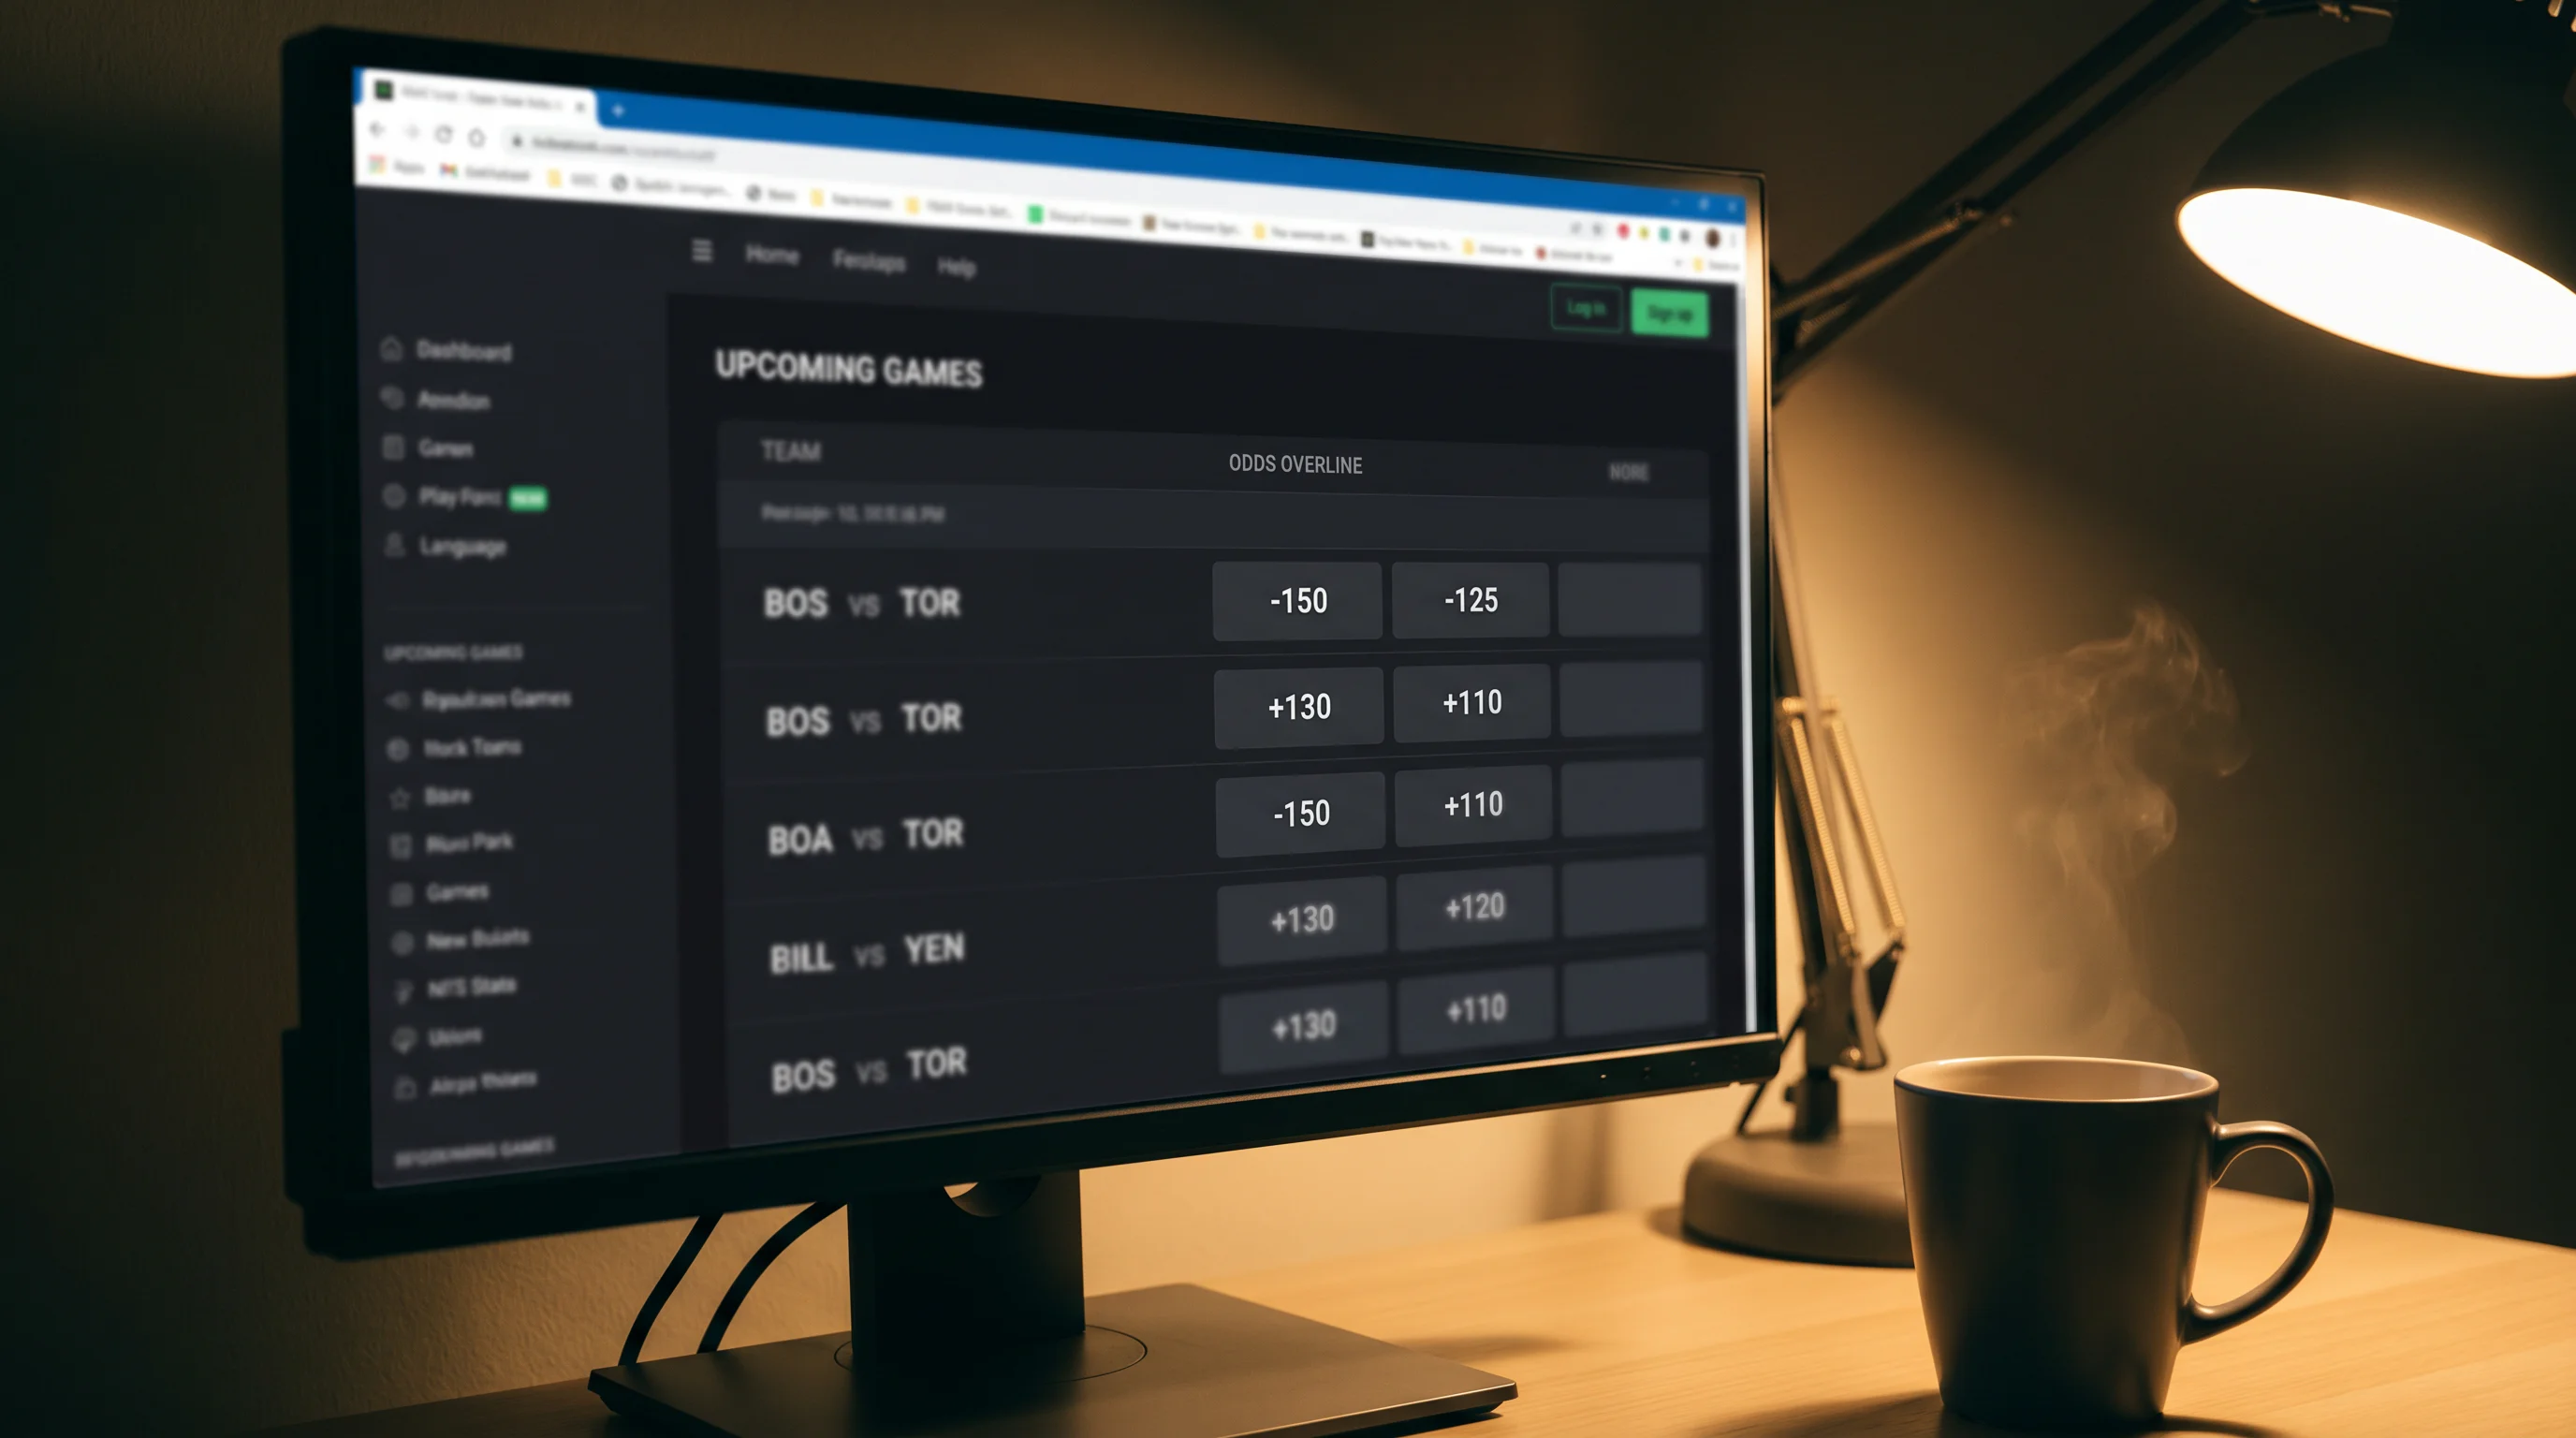
If you follow any NHL analyst, tipster, or data site based in North America — and you should, because that is where the best hockey analysis lives — you will encounter American odds constantly. They look strange at first. A favourite might be listed at -150. An underdog at +130. The positive and negative signs are doing real work here, and misreading them is a common and expensive mistake.
A negative number tells you how much you need to stake to win 100 units of currency. Odds of -150 mean you must wager 150 pounds to win 100 pounds in profit. A positive number tells you how much you win on a 100-unit stake. Odds of +130 mean a 100-pound bet returns 130 pounds in profit. The dividing line is -100/+100, which represents even money — the same as decimal 2.00 or fractional 1/1.
The conversion formulas are simple once you have seen them. For positive American odds, the decimal equivalent is (American odds divided by 100) + 1. So +130 becomes (130/100) + 1 = 2.30. For negative American odds, the formula is (100 divided by the absolute value of the American odds) + 1. So -150 becomes (100/150) + 1 = 1.67. I have these conversions memorised through sheer repetition, but a quick calculator or conversion tool works just as well.
American odds have one practical advantage: they make the favourite and underdog instantly visible. A negative number is always a favourite. A positive number is always an underdog. In decimal odds, you need to know that anything below 2.00 is a favourite and anything above is an underdog — which is simple enough, but the American format is more visually immediate. When scanning a full slate of NHL games on an American data site, the minus and plus signs let you identify the pricing structure at a glance.
The most important reason to understand American odds is research access. The best NHL betting data, models, and line tracking tools are American. If you cannot read -140/+120 fluently, you are cut off from the most valuable analysis ecosystem in hockey. Spend an hour converting a few dozen lines manually, and the format will become second nature.
Converting Between Formats: The Maths
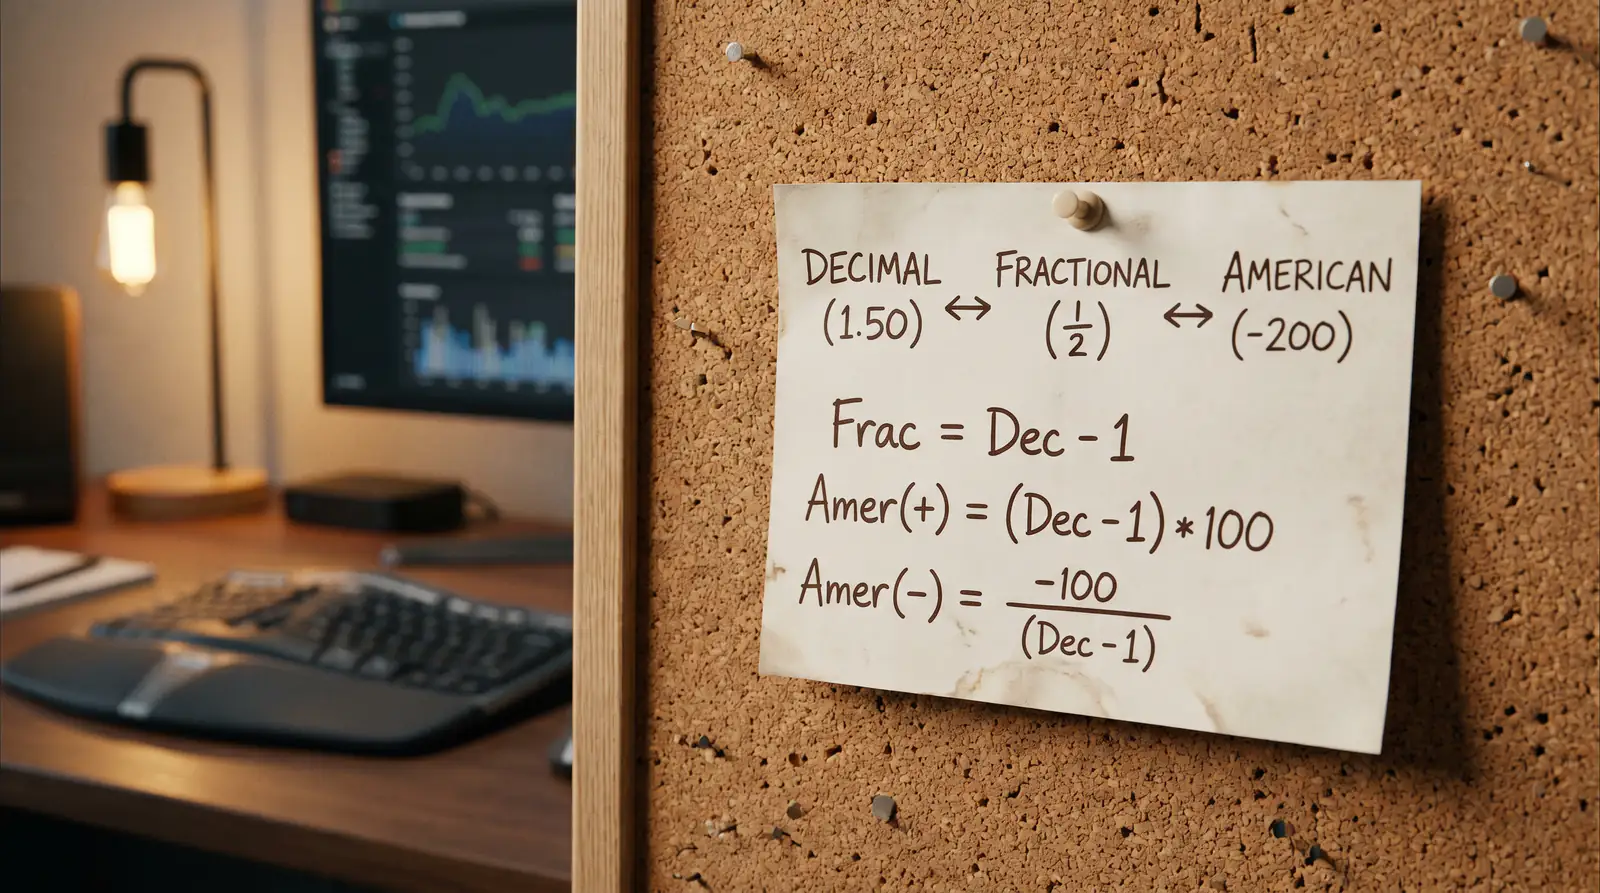
I keep a cheat sheet taped to my monitor. Not because the conversions are difficult — they are not — but because speed matters when you are comparing prices across UK and US platforms in real time. Here are all the conversion paths you need, with worked examples drawn from realistic hockey odds.
Decimal to fractional: subtract 1 from the decimal odds, then express the result as a fraction. Decimal 2.40 becomes 2.40 – 1 = 1.40, which simplifies to 7/5. Decimal 1.67 becomes 0.67, or approximately 2/3. Not every decimal price converts to a clean fraction, which is one reason fractional odds are falling out of favour for precise markets like hockey.
Decimal to American: if the decimal is 2.00 or above (underdog), multiply (decimal – 1) by 100. Decimal 2.40 becomes (2.40 – 1) x 100 = +140. If the decimal is below 2.00 (favourite), divide -100 by (decimal – 1). Decimal 1.67 becomes -100 / (1.67 – 1) = -149, which rounds to -150 in standard pricing.
Fractional to decimal: divide the numerator by the denominator and add 1. Fractional 7/5 becomes (7/5) + 1 = 2.40. Fractional 4/9 becomes (4/9) + 1 = 1.44.
American to decimal: for positive odds, divide by 100 and add 1. +140 becomes (140/100) + 1 = 2.40. For negative odds, divide 100 by the absolute value and add 1. -150 becomes (100/150) + 1 = 1.67.
In practice, you will use decimal-to-American and American-to-decimal conversions most often, because you are toggling between your UK bookmaker (decimal) and American data sources (American odds). The fractional conversions are useful mainly for communicating with other UK bettors who still think in traditional format.
Let me run through a complete real-world example. An American tipster recommends a play at -135 on the Colorado Avalanche. You open your UK bookmaker and see Colorado priced at 1.74. Converting -135 to decimal: 100/135 + 1 = 1.74. The prices match — the tip is based on the same line your bookmaker is offering. No edge from the recommendation alone, but you can now evaluate whether 1.74 represents value against your own probability estimate for Colorado.
The sportsbook hold averaged 10.15% across US operators in 2025. Understanding conversions lets you calculate that hold yourself. If Team A is priced at 1.74 and Team B at 2.25, the combined implied probability is (1/1.74 + 1/2.25) = 57.5% + 44.4% = 101.9%. The overround is 1.9%, which is a very tight margin — competitive for an NHL game. That number only becomes visible when you can move fluently between odds and probability.
Implied Probability and Overround
Every betting price contains a hidden probability estimate. Extracting that estimate is the most important mathematical skill in sports betting, and it takes about thirty seconds to learn. Once you can do it, you stop seeing odds as abstract numbers and start seeing them as the bookmaker’s opinion on who wins — an opinion you can agree with, disagree with, or exploit.

The formula for implied probability from decimal odds is: 1 divided by the decimal odds, multiplied by 100 to get a percentage. If a team is priced at 2.40, their implied probability is (1/2.40) x 100 = 41.7%. If the opponent is at 1.65, their implied probability is (1/1.65) x 100 = 60.6%. Add those together: 41.7% + 60.6% = 102.3%. The total exceeds 100% because the bookmaker’s margin is embedded in the prices.
That excess above 100% is the overround. In this example, the overround is 2.3%, which means the bookmaker has built a 2.3% cushion into the odds. This is their profit margin. A perfectly fair market — with no margin — would sum to exactly 100%. Real markets always exceed 100%, and the size of the overround tells you how much you are paying in implicit costs for the privilege of betting.
Overround varies by operator and by market type. Competitive UK bookmakers typically run 2-4% overround on NHL moneylines. Less competitive operators might carry 5-7%. Player props and exotic markets can run 10-15% or higher. The average US sportsbook hold of 10.15% in 2025 reflects the blended overround across all markets and sports — hockey-specific overrounds at sharp operators tend to be lower than this average, especially on headline games.
To find the “true” implied probability — stripped of the bookmaker’s margin — you can normalise the raw implied probabilities. Divide each team’s raw implied probability by the total. In the example above: Team A’s normalised probability is 41.7 / 102.3 = 40.8%. Team B’s is 60.6 / 102.3 = 59.2%. These normalised figures sum to 100% and represent a closer approximation of the market’s genuine probability assessment.
I use implied probability on every single bet I evaluate. My process starts with the bookmaker’s price, converts it to implied probability, and compares that to my own estimate. If my estimate is significantly higher than the bookmaker’s implied probability, I have a candidate for a value bet. If it is lower or roughly equal, I pass. This is not a guarantee of profit — my estimates are wrong sometimes — but it turns betting from guesswork into a structured decision with a clear rationale.
Hockey-Specific Odds: Puck Line, Totals, and Three-Way Prices
The standard moneyline is a two-way market — Team A or Team B wins. Hockey adds complexity because the sport has overtime and shootouts, which means a game can end in a tie after regulation. This creates room for the three-way market, the puck line, and the totals line to behave differently from their equivalents in other sports.
Puck line odds are structured around the 1.5-goal spread. The favourite at -1.5 typically sits between 2.30 and 2.80 in decimal odds, while the underdog at +1.5 usually ranges from 1.40 to 1.60. Those prices reflect the difficulty of winning by two or more goals in a sport where underdogs won 39.1% of games outright in the 2024-25 season. Underdogs covered the +1.5 puck line at roughly 60% that year — a stark illustration of how tight hockey scoring tends to be. The puck line odds factor in this historical distribution, but they do not always do it precisely, which is where value emerges.
Totals odds in hockey typically centre on a line of 5.5 or 6 goals. The over and under are priced close to even — commonly in the range of 1.85 to 1.95 for each side. When the line shifts to 5.5 with the over at 2.00 and the under at 1.80, the market is telling you it expects this particular game to skew toward fewer goals. Reading the direction of the pricing relative to the line number gives you insight into the market’s scoring expectation without needing to calculate anything.
The three-way market is unique to hockey and football in the UK betting landscape. It offers three outcomes: Team A wins in regulation, Team B wins in regulation, or the game is tied after 60 minutes (draw). Because roughly 23-25% of NHL games go to overtime, the draw price in a three-way market is never negligible. Three-way prices are always higher than two-way moneyline prices for the same teams, because the draw outcome absorbs some of the probability. If you back a team at 2.10 on the three-way and they win in overtime, your bet loses. The extra risk earns you better odds on a regulation-time win.
Understanding how these three market types interact — puck line, totals, and three-way — gives you the ability to choose the right vehicle for your opinion on any game. If you believe a team will win convincingly, the puck line at -1.5 offers better odds than the moneyline. If you believe the game will be tight but one team edges it, the moneyline is safer. If you have no view on the winner but expect high or low scoring, totals let you trade on that thesis. The flexibility is one of hockey betting’s greatest strengths.

Odds Shopping Across UK Bookmakers: Worked Example
I want to show you exactly how much money odds shopping saves, because most bettors nod along with the advice and then never actually do it. The numbers here are illustrative but based on the kind of price differences I see regularly across my own accounts.
Imagine you want to back the Edmonton Oilers on the moneyline for an evening game against the Dallas Stars. You check three UK bookmakers. Operator A has Edmonton at 2.10. Operator B has them at 2.15. Operator C has them at 2.05. The gap between the best and worst price is 0.10 in decimal terms — which sounds trivial until you run the maths over a full season.
On a 10-pound stake, the difference between 2.10 and 2.15 is 50 pence in potential return. Over 200 bets at the same average stake, that 50 pence per bet compounds to 100 pounds in additional returns — and that is assuming a conservative estimate of the average price gap. In practice, some games show much wider discrepancies, especially on puck lines and totals where bookmakers have less consensus on the correct price.
The process takes ten to fifteen seconds per bet. Open two or three bookmaker tabs, search for the game, compare the price on your selected outcome, and place the bet at the best number. I have timed myself doing this, and it rarely takes longer than it takes to type the stake amount. The return on that time investment is the highest in all of sports betting, which is why every serious bettor I know shops odds religiously.
The NHL is a growing betting product. Gary Bettman, the league’s Commissioner, noted at the 2026 State of the League address that every platform and every source of revenue continues to grow. That growth means more bookmakers are pricing hockey seriously, which increases the number of available prices and the likelihood of finding meaningful discrepancies. Five years ago, odds shopping in UK hockey meant comparing two operators. Today, you can compare four or five with genuine market depth — and the more prices you compare, the more value you capture.
One caveat: odds shopping is only effective if you are placing bets at operators you trust. Chasing a slightly better price at an unlicensed or unregulated offshore bookmaker is false economy. The extra 0.05 in decimal odds is worthless if you cannot withdraw your winnings. Stick to UKGC-licensed operators, compare within that pool, and the savings will accumulate steadily over any betting season.
Hockey Odds Questions
These three questions come up repeatedly from bettors transitioning into hockey from other sports. The answers are deliberately concise — if you have read the sections above, you already know most of this, but the quick-reference format is useful.
What does +1.5 mean in hockey betting?
The +1.5 is the puck line for the underdog. It means the team receives a 1.5-goal head start for betting purposes. Your bet wins if the team either wins the game outright or loses by exactly one goal. The only way it loses is if the team loses by two or more goals. It is the hockey equivalent of a point spread in American football or an Asian handicap in football.
Why do NHL odds differ between UK and American sportsbooks?
UK and American bookmakers set their own prices independently based on the action they receive and their internal models. Different customer bases create different demand profiles, which push prices in different directions. American sportsbooks also typically display odds in American format, which can make direct comparison confusing. Convert everything to decimal before comparing, and the differences become clear and measurable.
How do I calculate implied probability from decimal odds on a hockey match?
Divide 1 by the decimal odds and multiply by 100. If a team is priced at 2.40, the implied probability is (1 / 2.40) x 100 = 41.7%. To find the bookmaker’s margin, add the implied probabilities for all outcomes — if they sum to more than 100%, the excess is the overround. A two-way moneyline with a 102% total has a 2% margin built into the prices.
