
 Available in US
Content
- Why Hockey Remains a Softer Betting Market
- The Value Betting Framework for Hockey
- Underdog Trends: Where the Numbers Point
- Goaltending: The Single Biggest Line Mover
- Why Schedule Context Matters
- Tracking Line Movement and Closing Line Value
- Staking Models for Hockey Bettors
- Seasonal Angles: Playoffs, Trade Deadline, Olympics
- Hockey Betting Strategy Questions

Why Hockey Remains a Softer Betting Market
Three years ago, I ran a six-month parallel test: identical bankrolls, identical staking methodology, one on NHL moneylines and one on Premier League match winners. The NHL account finished up 14%. The football account finished down 3%. The sample was small, but the reason behind the gap was not mysterious — hockey lines are softer because fewer sharp bettors hammer them.
NHL underdogs won outright at a 39.1% rate during the 2024-25 season. That is not a misprint. In a sport where the favourite wins barely six out of ten games, pricing inefficiencies are structurally baked in. Football, by contrast, has been picked clean by syndicates and algorithms for decades. The NHL’s relative obscurity in the UK betting ecosystem means bookmakers devote fewer resources to modelling it precisely, and the resulting lines leave gaps for anyone willing to do the analytical work.
This article is not a collection of “hot tips.” It is a framework — a set of tools and perspectives that let you identify value systematically rather than chasing hunches. Every section covers a specific strategy angle with enough depth to act on it immediately. If you apply even two or three of these consistently, you will be operating at a level above the majority of recreational hockey bettors.
The Value Betting Framework for Hockey
I spent my first two years betting on hockey picking winners. My hit rate was fine — around 55% on moneylines — but my bankroll barely moved. The problem was not my selections. The problem was that I had no concept of value. Picking winners and finding value are two completely different skills, and only the second one makes money over time.
Value exists when the probability you assign to an outcome is higher than the probability implied by the bookmaker’s odds. If you believe a team has a 50% chance of winning and the bookmaker prices them at 2.20 (implying a 45.5% chance), the gap between your estimate and theirs is your edge. Over hundreds of bets, that edge compounds. Over five or ten bets, it might look like noise. Understanding this distinction is what separates systematic bettors from gamblers.
The expected value formula is straightforward: (probability of winning multiplied by the profit if you win) minus (probability of losing multiplied by the stake). If your 50% team at 2.20 odds produces an EV of +0.10 per pound wagered, that means you expect to earn 10 pence for every pound you bet over the long run. That sounds modest until you consider the alternative: the average US sportsbook hold in 2025 was 10.15%, meaning recreational bettors lost roughly 10 pounds of every 100 wagered. Simply finding bets with positive expected value puts you on the right side of that equation.
Building your own probability estimates for hockey games does not require a PhD in statistics. Start with a baseline: historical home-ice winning percentage in the NHL hovers around 55%. Adjust that baseline for the specific matchup — goaltender quality, recent team form, rest advantage, travel schedule. Each adjustment shifts your probability estimate by a few percentage points. The goal is not precision to the decimal. The goal is to be roughly right more often than the bookmaker’s line implies.
I keep a simple spreadsheet for every bet I place. Three columns: my estimated probability, the bookmaker’s implied probability, and the gap between them. Over a season, patterns emerge. Certain game types produce consistently positive gaps. Others consistently negative. That data tells me where to focus and where to stay away — which is more valuable than any single tip.
The rest of this article covers the specific angles where I have found those positive gaps most reliably. Each one feeds into this framework: identify a mispricing, quantify it, and act on it with disciplined staking.

Underdog Trends: Where the Numbers Point
If someone told you there was a major professional sport where the underdog won nearly four out of every ten games and covered a 1.5-goal spread six times out of ten, you would assume the market had already priced that in. In hockey, it has not — at least not fully.
The 2024-25 NHL season produced an outright underdog win rate of 39.1%. Among the four major North American leagues, only baseball saw more upsets. The structural reasons are well understood: a hot goaltender can steal any single game, power play goals inject randomness into scoring sequences, and the shootout mechanism gives trailing teams a built-in comeback path. What is less well understood is how persistently these factors create betting value.
Puck line data reinforces the pattern. Underdogs covered the +1.5 spread at roughly 60% during the same season. That means if you had blindly backed every NHL underdog on the puck line for an entire year, you would have cashed on six out of ten bets. Blind betting is not a strategy I recommend — the margins on puck line underdogs are thin, and you need to be selective — but the baseline tells you something important about the sport’s competitive structure. Hockey games are tight. Blowouts are rare compared to basketball or American football.
The most profitable sub-angle within underdog betting is the home underdog. During the 2024-25 season, home underdogs posted an against-the-spread record of 329 wins against 186 losses — a 63.9% cover rate. That is an extraordinary number. Home ice advantage in hockey is real and measurable, providing a familiar crowd, last line change (the home team gets to match lines after the visiting team), and no travel fatigue. When a team has all of those advantages and the bookmaker still prices them as an underdog, the market is often undervaluing them.
I do not bet every home underdog blindly. I filter for specific conditions: a confirmed starting goaltender with a save percentage above .910 over the last ten starts, an opponent on the second night of a back-to-back, and a moneyline price above 2.00. That filter eliminates about two-thirds of the opportunities but concentrates the edge. Over the last two full seasons, that filtered set has returned a positive ROI north of 8% — not life-changing money, but consistent and repeatable.
The broader lesson is this: hockey’s competitive balance is your friend as a bettor. In a sport where the best team and the worst team are separated by a smaller gap than in almost any other league, the underdog is always in the game.

Goaltending: The Single Biggest Line Mover
No single player in team sports moves a betting line like an NHL goaltender. I have seen a moneyline shift from 1.80 to 2.10 in the hour after a starting goalie change was announced — a swing that completely redefines the value proposition of the bet. The difference between a team’s number-one goalie and their backup can be worth half a goal per game or more, which in a sport where totals hover around 5.5 is enormous.
The practical takeaway for your strategy is simple: never place a pre-game hockey bet until starting goaltenders are confirmed. Lineups are typically announced one to two hours before puck drop. If you have already locked in a price and the goalie news breaks against you, you have no recourse. Wait for confirmation, then assess whether the odds still represent value given who is actually defending the crease.

Why Schedule Context Matters
The NHL regular season packs 82 games into roughly seven months, and the schedule is not evenly distributed. Teams frequently play on consecutive nights — back-to-back situations that compress recovery time and force coaches to rotate goaltenders. A team playing their second game in two nights, especially with travel between cities, is measurably less sharp than one coming off two days of rest.
Schedule context extends beyond back-to-backs. Long road trips, games before and after the All-Star break, and the compressed stretch run before the trade deadline all create fatigue patterns that the market does not always price efficiently. I treat the schedule as a filter: when two teams are closely matched, the one with the rest advantage gets a meaningful bump in my probability model.

Tracking Line Movement and Closing Line Value
Early in my betting career, I was obsessed with whether individual bets won or lost. It took me two full seasons to realise that the real measure of skill is not your win rate — it is whether you consistently beat the closing line.
Closing line value, or CLV, is the difference between the odds at which you placed your bet and the odds at which the market closed just before puck drop. If you back a team at 2.20 and the price closes at 2.05, you captured positive CLV — the market moved toward your position after you bet, confirming that you identified value before the crowd did. Over large samples, bettors who consistently beat the closing line are profitable, and bettors who do not are not. This holds regardless of short-term results.
Tracking line movement in hockey is easier than in football because the market is thinner. When sharp money enters an NHL game, the line moves quickly and visibly. If you notice a favourite drifting from 1.70 to 1.80 without any obvious injury news or goaltender change, that drift usually signals informed money landing on the underdog. You do not need to follow the sharps blindly, but understanding why a line is moving gives you a critical information advantage.
The sportsbook hold — the margin the bookmaker builds into their prices — averaged 10.15% in the United States in 2025. That number represents the headwind every bettor faces. To overcome a 10% hold, you need to find bets where your edge exceeds the margin baked into the odds. CLV tracking tells you whether you are actually doing that or just getting lucky. I log my CLV on every bet, and I review the data monthly. Months where my average CLV is positive tend to be profitable months. Months where it is negative tend to be losing months, even if my win rate looks acceptable.
The practical application is straightforward: bet early when you have an opinion, record the closing line, and measure the gap over time. If you consistently get better numbers than the close, your process is working. If not, your models need adjustment — no matter how many bets you are winning in the short term.

Staking Models for Hockey Bettors
A friend of mine — sharp bettor, genuinely good at hockey analysis — blew a 500-pound bankroll in three weeks. His edge was real. His staking was reckless. He was putting 10-15% of his bankroll on individual bets, and a cold streak of eight losses in a row wiped him out before his edge had a chance to compound.
The simplest staking model is flat betting: wager the same fixed amount on every bet, typically 1-2% of your total bankroll. On a 500-pound bankroll, that means 5 to 10 pounds per bet. This approach will never maximise returns during a hot streak, but it protects you from ruin during the inevitable cold stretches. Hockey betting has high variance — even a strategy with a genuine 5% edge will produce losing weeks and losing months. Flat staking absorbs those swings without forcing you to reload your account.
A more aggressive alternative is percentage-of-bankroll staking, where each bet is a fixed percentage of your current balance. If your bankroll grows, your stakes grow proportionally. If it shrinks, your stakes shrink. This naturally accelerates compounding when you are winning and slows losses when you are not. The downside is that it requires constant recalculation and more discipline than most people realise.
The Kelly criterion is the mathematical gold standard. It tells you exactly how much to stake based on your estimated edge and the odds available. The formula produces optimal growth over the long run, but it demands accurate probability estimates — and in practice, most bettors overestimate their edge. A common compromise is fractional Kelly, where you stake one-quarter or one-half of the Kelly-recommended amount. This sacrifices some theoretical growth for a dramatic reduction in volatility.
I use a hybrid approach: flat stakes at 1.5% of bankroll for standard bets, with a bump to 2.5% for plays where my estimated edge exceeds 8%. That bump happens on maybe 15% of my bets. The rest are standard size. The discipline of keeping stakes consistent is more important than which model you choose — pick one, commit to it, and resist the urge to chase losses with oversized bets.

Seasonal Angles: Playoffs, Trade Deadline, Olympics
The NHL is not a single, uniform betting market. It is a series of distinct phases, each with its own dynamics, and the bettors who adjust their approach to the calendar consistently outperform those who treat November the same as April.
The regular season runs from October to mid-April, but the early weeks play differently from the stretch run. In October and November, teams are still establishing their identity — new players integrating, coaching systems gelling, goaltenders finding their rhythm. Lines during this period are based heavily on preseason projections and prior-year data, which creates value for anyone tracking actual performance in real time. A team that lost key players over the summer will still carry inflated odds from their previous season’s reputation for weeks before the market adjusts.
The trade deadline in early March reshapes the landscape overnight. Contending teams add rental players, rebuilding teams trade away their best assets, and the competitive balance shifts in ways that preseason models cannot predict. I treat the two weeks after the trade deadline as a high-opportunity window. Bookmakers update their lines, but the full impact of roster changes takes time to manifest in the odds. A team that acquires a top-six forward or a reliable backup goaltender may not see their price adjust until a week of results proves the upgrade was real.
The 2026 season introduced an additional variable: the Winter Olympics in Milano Cortina. The NHL paused its season for three weeks to allow players to represent their national teams, creating a mid-season break that disrupted momentum, fitness, and team chemistry. The post-Olympics stretch produced unpredictable results as teams re-integrated players returning from international duty — a scheduling wrinkle that bookmakers priced unevenly.
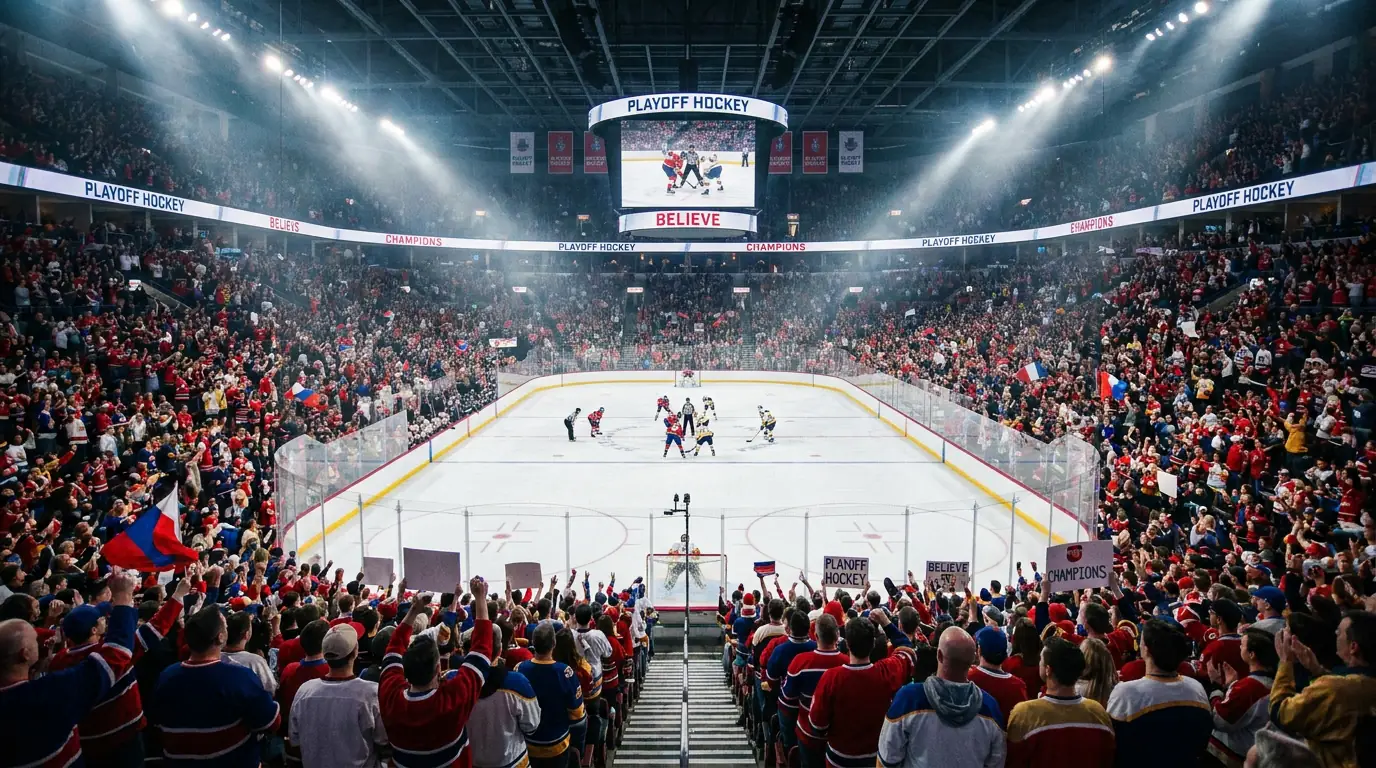
Playoff hockey is a different sport entirely. Gary Bettman, the NHL Commissioner, said at the 2026 State of the League press conference that every platform and every source of revenue is growing — and the playoffs are where that growth concentrates most visibly. Series betting replaces individual game markets as the primary focus. Home ice advantage amplifies. Goaltending becomes even more dominant. The variance that defines the regular season compresses in a seven-game series, and the better team wins more often. Adjust your models accordingly: the edges in playoff hockey are smaller but more predictable.
Hockey Betting Strategy Questions
Strategy questions deserve detailed answers. These four address the patterns I see most often from bettors making the transition from recreational punting to systematic analysis.
Is hockey a more profitable sport to bet on than football or basketball?
Hockey offers wider pricing inefficiencies than football or basketball because fewer sharp bettors and syndicates focus on the NHL. The 39.1% underdog win rate creates structural upset frequency that bookmakers struggle to price perfectly. That does not mean hockey is automatically profitable — you still need an analytical edge and disciplined staking. But the ceiling for a skilled bettor is higher in hockey because the competition is thinner.
How does the 2026 NHL salary cap rise affect team strength for bettors?
The NHL salary cap is set at $95.5 million for 2025-26 and is projected to rise to $104 million the following season. Teams with cap space can add impact players during the season or at the trade deadline, which changes their competitive outlook mid-year. Bettors should track which teams have significant cap room and which are capped out, because roster flexibility translates directly into the ability to improve through acquisitions.
What is closing line value and why does it matter in hockey?
Closing line value is the difference between the odds you got when placing your bet and the odds available at puck drop. If you consistently bet at better odds than the closing line, you are identifying value before the market catches up. CLV is the single best predictor of long-term profitability in sports betting and is especially useful in hockey where line movement can be sharp and sudden around goaltender announcements.
Should hockey bettors focus on specific game types or bet every NHL slate?
Selectivity beats volume. The most profitable approach is to identify the specific game types where your models have a demonstrated edge — home underdogs, back-to-back situations, goaltender mismatches — and bet only those. Betting every game on the slate dilutes your edge with noise. I typically bet on 15-20% of NHL games in a given week, focusing on spots where my analysis gives me the highest confidence.
