
 Available in US
Content
Home Ice Gives NHL Teams a Measurable but Misunderstood Edge
I used to think home ice advantage in hockey was basically a coin flip dressed up in nostalgia. Then I pulled five seasons of data and realised the advantage is real, consistent, and – most importantly for us – mispriced. Home underdogs posted an ATS record of 329-186 in the 2024-25 NHL season, covering the puck line at a 63.9% rate. That number changed how I build my entire weekly betting card. Home ice is not a tiebreaker or a marginal factor. It is a structural edge that the market systematically undervalues in specific situations.
The challenge is that home ice advantage is not uniform. It varies by team, by venue, by time of season, and by the specific opponent on the other side of the ice. Treating it as a blanket boost – “add 3% to the home team’s win probability” – is lazy analysis that misses the nuance. The real edge comes from understanding why home ice matters, which teams benefit most, and when the market fails to account for it.

Why Home Ice Matters: Last Change, Travel, and Crowd Energy
Every time I explain home ice advantage to someone new to hockey betting, I start with a rule that does not exist in most other sports: the home team gets the last line change after stoppages. This means the home coach sees which players the visiting team sends over the boards and then selects his own players to create a favourable matchup. A top defensive pair can be deployed against the opponent’s best forward line. A sheltered offensive forward can be hidden from the opponent’s shutdown centre. Over 60 minutes, these micro-advantages accumulate into measurable outcome differences.

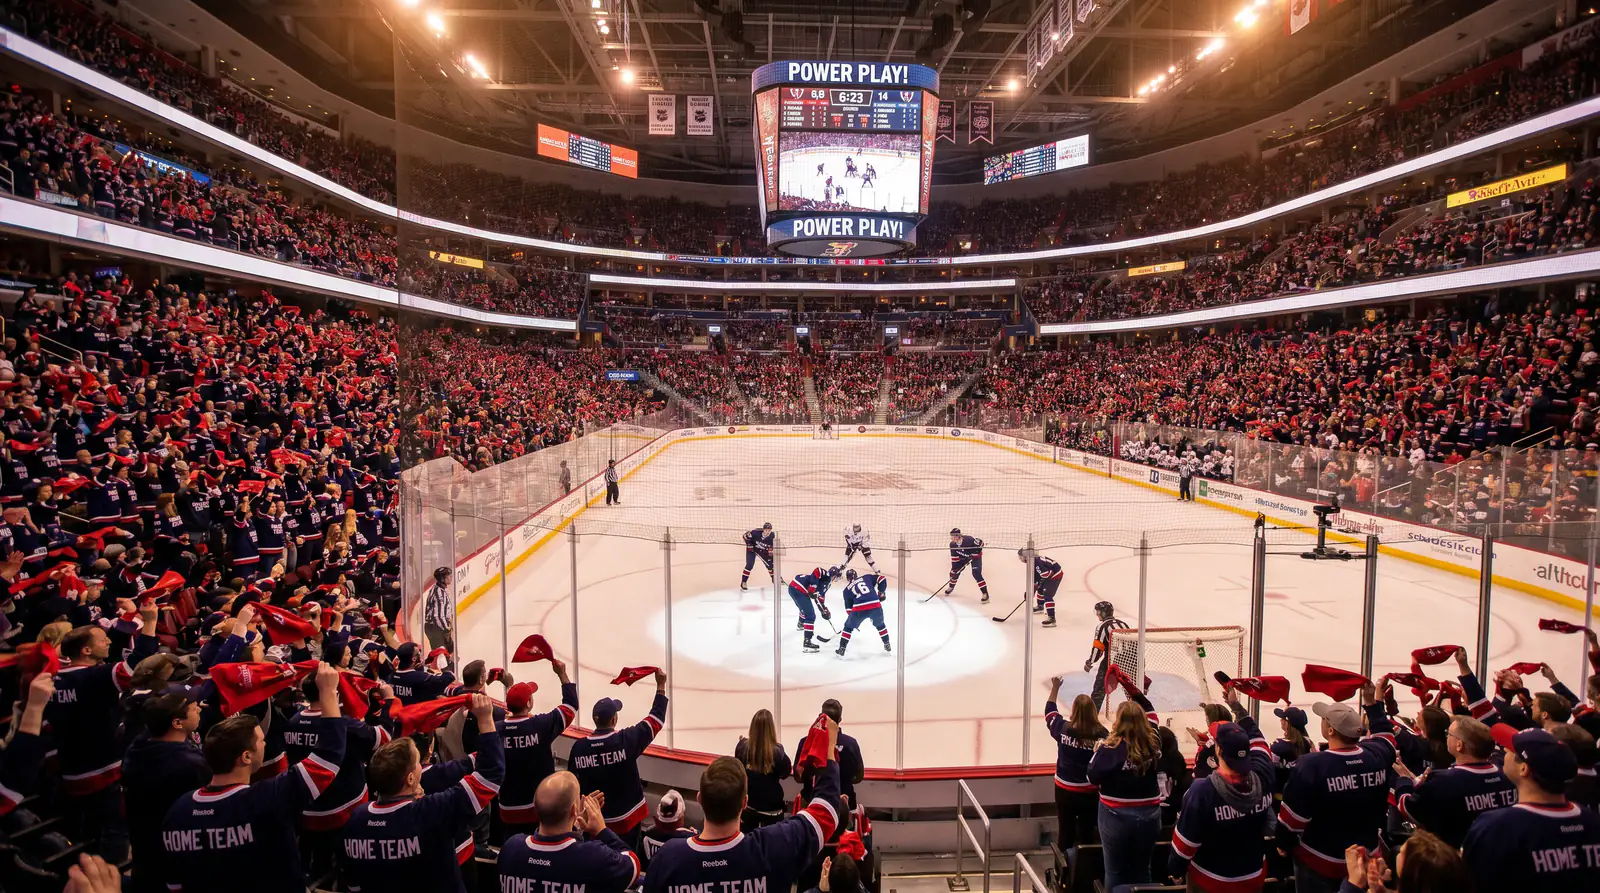
NHL gate receipts at 96% of arena capacity in 2024-25 tell you these buildings are loud and full. Crowd energy is the hardest advantage to quantify but the easiest to observe. A raucous home crowd creates noise that disrupts on-ice communication, adds pressure during key moments like penalty kills, and generates momentum after home goals. Some arenas are measurably louder than others, and teams that play in the loudest venues – packed, enclosed rinks with acoustics that amplify sound – tend to show stronger home ice advantages in the data.
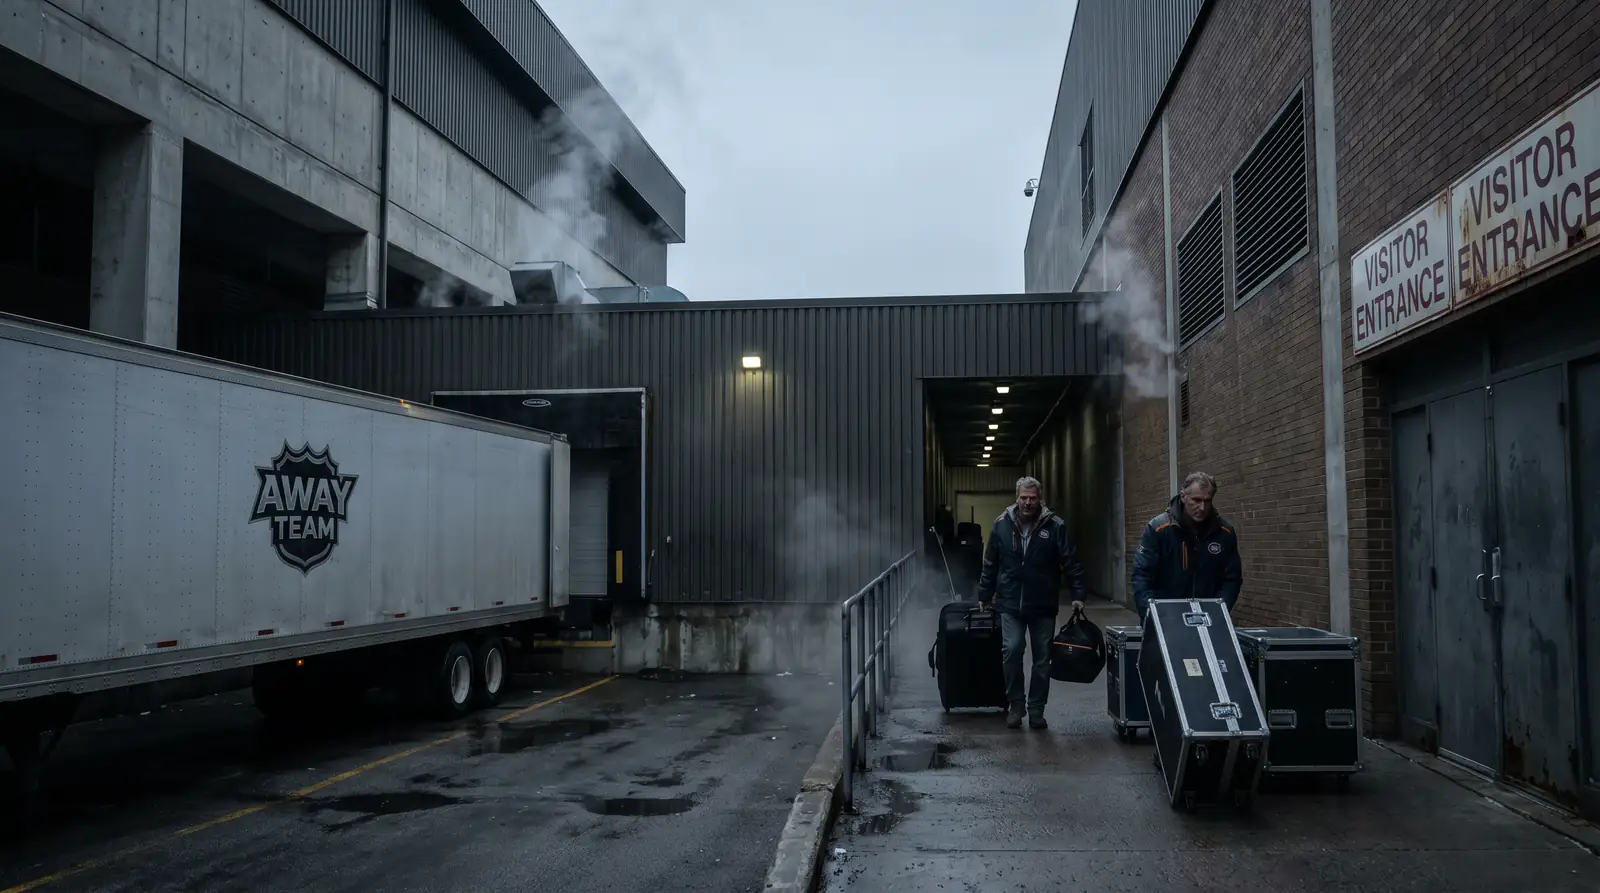
Travel is the third factor. The NHL schedule is punishing. Teams criss-cross North America, sometimes playing in three different time zones within a week. The visiting team often arrives the night before or the morning of the game, while the home team sleeps in their own bed, follows their usual routine, and arrives at the arena with no travel fatigue. The effect is subtle but real: road teams perform slightly worse in the first period than the second or third, suggesting the travel impact is strongest early in the game before adrenaline compensates.
Home Underdogs by the Numbers
The headline stat bears repeating: 63.9% cover rate for home underdogs on the puck line in 2024-25. But the layers beneath that number are where the actionable insight lives.
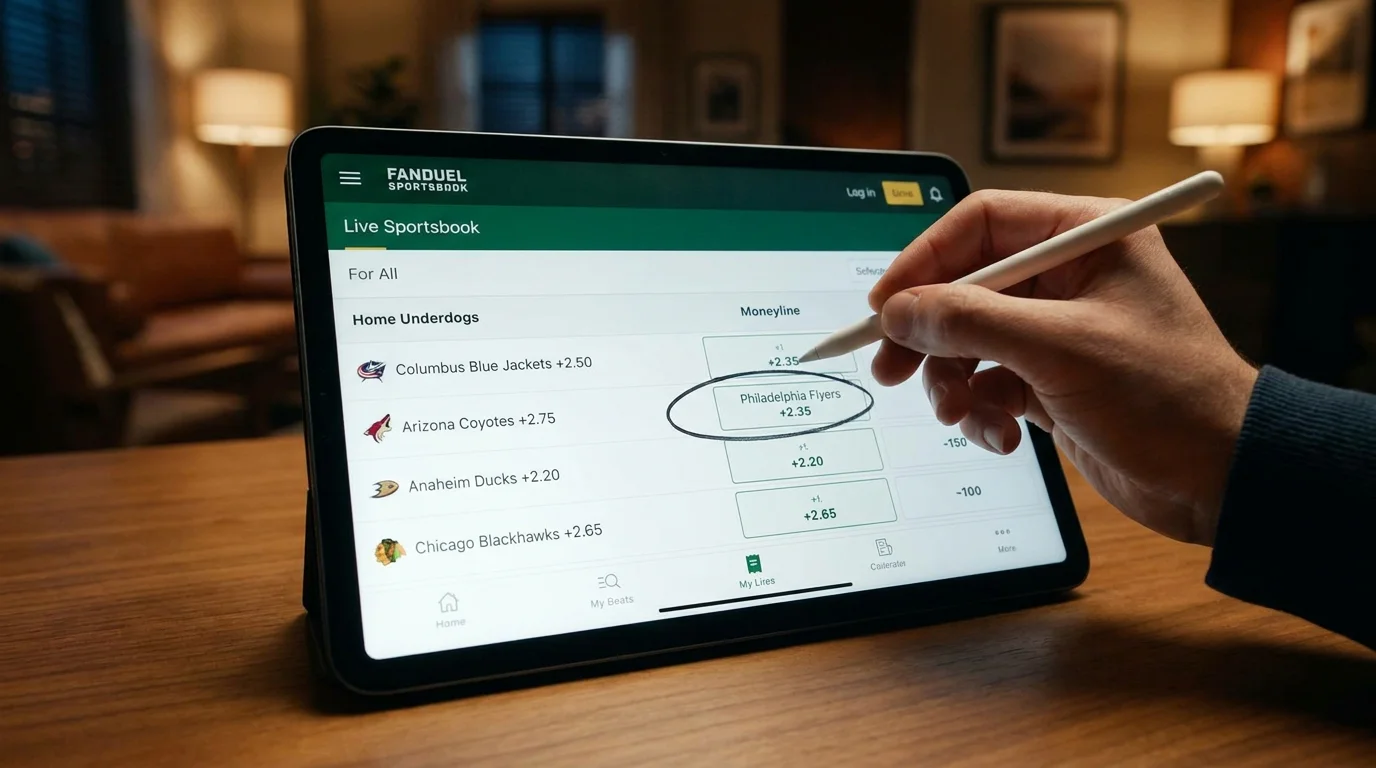
I segmented home underdogs by price range. Dogs priced between 2.20 and 2.80 on the moneyline – mild to moderate underdogs – covered the puck line at about 65%. Dogs priced above 3.00 – heavy underdogs – covered at about 58%. The sweet spot is the mild underdog range, where the team is close in quality to the visiting favourite and the home ice benefits are enough to close the gap. Once you get into heavy underdog territory, the skill gap is large enough that home ice cannot fully compensate.
Divisional matchups produced a higher home underdog cover rate than non-divisional games in my dataset. This makes intuitive sense: divisional opponents are familiar with each other’s systems, which neutralises the visiting team’s ability to exploit schematic advantages. In a game where both teams know each other’s tendencies, the home ice benefits – last change, crowd, familiarity with the boards and ice surface – carry more relative weight.
The time-of-season split was also revealing. Home underdogs covered at higher rates in October and November (early season) and again in March and April (stretch run) compared to December and January (mid-season). Early-season variance favours underdogs broadly, and the stretch run introduces playoff pressure that amplifies home crowd intensity. The underdog strategy gains additional traction when you layer in this seasonal filter.
Applying Home Ice Data to Your Betting
I do not bet every home underdog blindly. The 63.9% cover rate is an average across all home dogs, and averages mask the range. Some home underdogs are genuinely inferior teams who happen to be playing at home, and backing them is throwing money away. The process is about filtering the pool to find the situations where home ice advantage is most likely to produce a cover.
My filtering criteria are specific. First, the home team must have a winning record at home over their last 15 home games. A team with a poor home record is not benefiting from home ice in any meaningful way, and the data confirms that these teams cover at rates below the puck line break-even point. Second, the goaltender matchup must be neutral or favourable – I do not back home dogs who are running a backup against the visitor’s top starter. Third, the visiting team should ideally be on the second game of a road trip or the second night of a back-to-back, which amplifies the travel fatigue factor.

When all three criteria align – strong home record, neutral-to-favourable goaltending, and fatigued visitor – the cover rate in my backtest data exceeds 70%. Those spots do not appear every night, but across an 82-game schedule they arise frequently enough to build a meaningful position.
One thing I have learned is to resist the temptation to overcomplicate the model. Adding more and more filters eventually reduces the sample size to the point where any result is statistically meaningless. Three to four well-chosen criteria give you a filtered pool that is both profitable and large enough to bet into regularly. Beyond four criteria, you are probably overfitting to historical noise rather than identifying genuine signal. Keep the framework simple, trust the numbers, and let the volume of qualifying games do the heavy lifting over the course of a full season.

Home Ice Betting Questions
How strong is home ice advantage in the NHL compared to other sports?
NHL home teams win approximately 54-56% of regular-season games, which is comparable to the NFL and slightly below the NBA’s home win rate. However, the betting edge is strongest in the NHL because the market consistently underprices home underdogs, particularly on the puck line. The 63.9% ATS cover rate for NHL home underdogs in 2024-25 significantly exceeds equivalent figures in other sports.
Does home ice advantage increase during the NHL playoffs?
Yes. Playoff home ice advantage tends to be stronger than the regular season because arenas are at full capacity, crowds are more intense, and the stakes amplify every factor that makes home ice valuable. Historically, the team with home ice advantage in an NHL playoff series wins the series about 55-57% of the time, and that edge is concentrated in games one, two, and seven.
