
 Available in US
Content

No Edge Survives Poor Money Management
In my third year of serious hockey betting, I had a genuinely profitable model. My closing line value was positive, my hit rates exceeded break-even on every market I played, and I felt invincible. Then I went on a 14-bet losing streak in February – statistically unlikely but mathematically inevitable over a long enough timeline – and blew through 40% of my bankroll in nine days because my stake sizes were too large. The model was fine. My money management nearly killed it. The U.S. sportsbook hold averaged 10.15% in 2025, which means the house takes its cut on every bet you place. Your staking model determines whether you survive long enough for your edge to overcome that rake.

Bankroll management is the least glamorous topic in sports betting and the most important one. A positive expected value strategy with poor staking will go bust. A marginal strategy with disciplined staking can survive and compound. The maths is unambiguous on this point, and every professional bettor I have spoken to over the last decade agrees: the staking plan matters as much as the picks.
Three Staking Models Compared: Flat, Percentage, and Kelly
There is no single correct staking model, but there are objectively wrong ones – and “whatever feels right” is at the top of the wrong list. Here are the three models I have tested extensively in my own hockey betting.
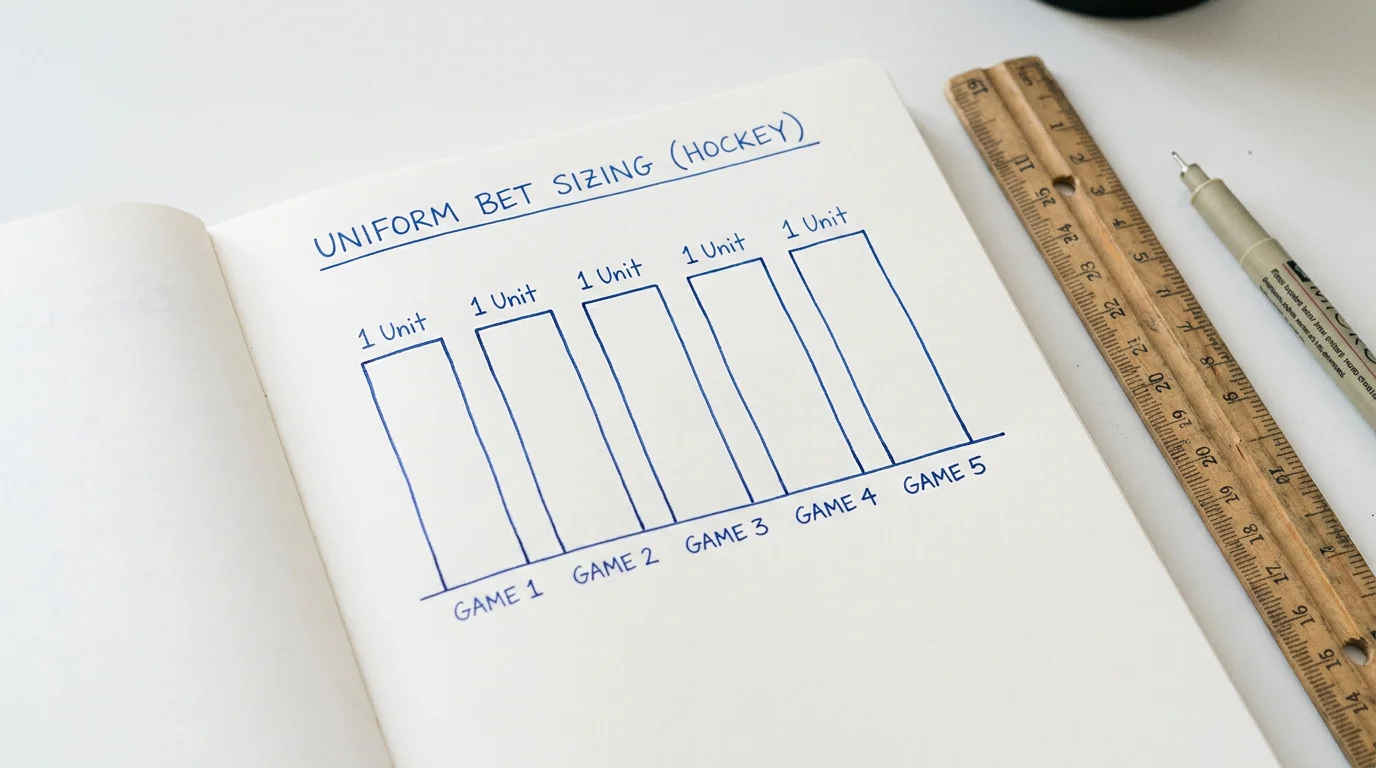
Flat staking means betting the same absolute amount on every wager regardless of confidence or odds. If your unit is 20 pounds, every bet is 20 pounds whether it is a 1.50 favourite or a 3.80 underdog. The advantage is simplicity: you cannot over-leverage on a single game, and your drawdowns are predictable. The disadvantage is that it does not differentiate between high-confidence and low-confidence plays. I used flat staking for my first four years and it served me well as a foundation. For most bettors, flat staking at 1-2% of bankroll per bet is the right starting point.
Percentage staking adjusts the absolute amount based on your current bankroll. If you bet 2% of your bankroll and your bankroll grows from 1,000 to 1,200, your stake increases from 20 to 24. If your bankroll drops to 800, your stake decreases to 16. This model is self-correcting: it scales up during winning runs and scales down during losing runs, reducing the risk of ruin compared to flat staking. The downside is psychological – betting less when you are losing feels counterintuitive, and some bettors override the system and increase stakes to “catch up,” which defeats the purpose entirely.
Kelly criterion calculates the optimal stake size based on your estimated edge and the offered odds. The formula is: (bp – q) / b, where b is the decimal odds minus one, p is your estimated probability of winning, and q is one minus p. If you estimate a 55% chance of winning at odds of 2.00, Kelly recommends staking 10% of your bankroll. In practice, full Kelly is too aggressive for most bettors because the estimated edge is never certain. I use quarter-Kelly or half-Kelly, which reduces variance dramatically while still scaling stakes to confidence level. The expected value framework is the natural companion to Kelly staking because both require you to estimate true probabilities.

Why Hockey’s Variance Demands Conservative Staking
Hockey is the highest-variance major sport for bettors. NHL underdogs win 39.1% of the time, which means a favourite at 1.60 – a price that implies 62.5% win probability – will lose four out of every ten bets even when the price is accurate. That losing rate is brutal on aggressive staking models.
I simulated 10,000 seasons of NHL betting using historical results and different staking models. At 5% per bet (flat staking), the probability of a 50% drawdown within a single season exceeded 30%. At 2% per bet, it dropped to 8%. At 1% per bet, it was under 2%. The difference between a 30% chance of catastrophic drawdown and a 2% chance is the difference between an approach that works in theory but fails in practice and one that actually compounds your edge over years.

The NHL’s 82-game regular season is a grind. Add in playoffs and you are potentially betting across 1,300+ games over eight months. That volume is your friend if your staking is conservative enough to absorb the inevitable losing stretches. A 1% flat stake means a 14-bet losing streak costs you 14% of your bankroll – painful but survivable. At 3%, the same streak costs 42%, and recovery becomes nearly impossible without either adding funds or dropping down to micro-stakes.
Setting Up Your Hockey Bankroll: A Step-by-Step Example
Here is the exact process I use at the start of every NHL season. First, I determine the total amount I am prepared to allocate to hockey betting for the entire season. This is money I can afford to lose completely without affecting my financial obligations. For the sake of this example, let us say that amount is 1,000 pounds.
Second, I set my base unit at 1% of the bankroll: 10 pounds per bet. This is my flat stake for standard plays. For high-confidence plays where my estimated edge exceeds 8%, I allow a 1.5x unit (15 pounds). For lower-confidence plays, I stay at the base. I never exceed 2% of my current bankroll on any single wager, regardless of how strong the play looks.
Third, I establish drawdown thresholds. If my bankroll drops to 750 (25% drawdown), I reassess my model and reduce my unit to 1% of the new balance. If it drops to 500 (50% drawdown), I stop betting for two weeks, review every aspect of my process, and resume only if I identify a fixable issue. If I cannot identify the problem, I accept that the season is a loss and preserve the remaining capital.

Fourth, I track every bet in a spreadsheet with the following fields: date, game, market, selection, odds, stake, result, profit/loss, running bankroll, and closing line. That last column – closing line – is the most important. If my bets consistently beat the closing line, my process is sound even during losing stretches. If I am not beating the closing line, no amount of bankroll management will save me.

Fifth, I review my results monthly. I look at ROI by market type, by day of the week, by stake level, and by confidence tier. If one market is dragging my results down – say, player props are consistently losing while moneylines are profitable – I reduce or eliminate the underperforming market from my rotation. Monthly reviews keep the bankroll managed and the strategy evolving.
Bankroll Management Questions
What unit size should I use for NHL betting?
A base unit of 1-2% of your total bankroll is the standard recommendation for NHL betting. If your bankroll is 1,000 pounds, your unit would be 10-20 pounds per bet. This level is conservative enough to survive losing streaks of 10-15 bets while still allowing meaningful returns during winning periods.
How does Kelly criterion work for hockey bets?
The Kelly criterion calculates optimal stake size using the formula (bp – q) / b, where b is the decimal odds minus one, p is your estimated win probability, and q is one minus p. Most experienced bettors use quarter-Kelly or half-Kelly to reduce variance. The approach requires you to accurately estimate your true win probability, which is the hardest part of the process.
