
 Available in US
Content

The Salary Cap Is the Hidden Variable Most Hockey Bettors Ignore
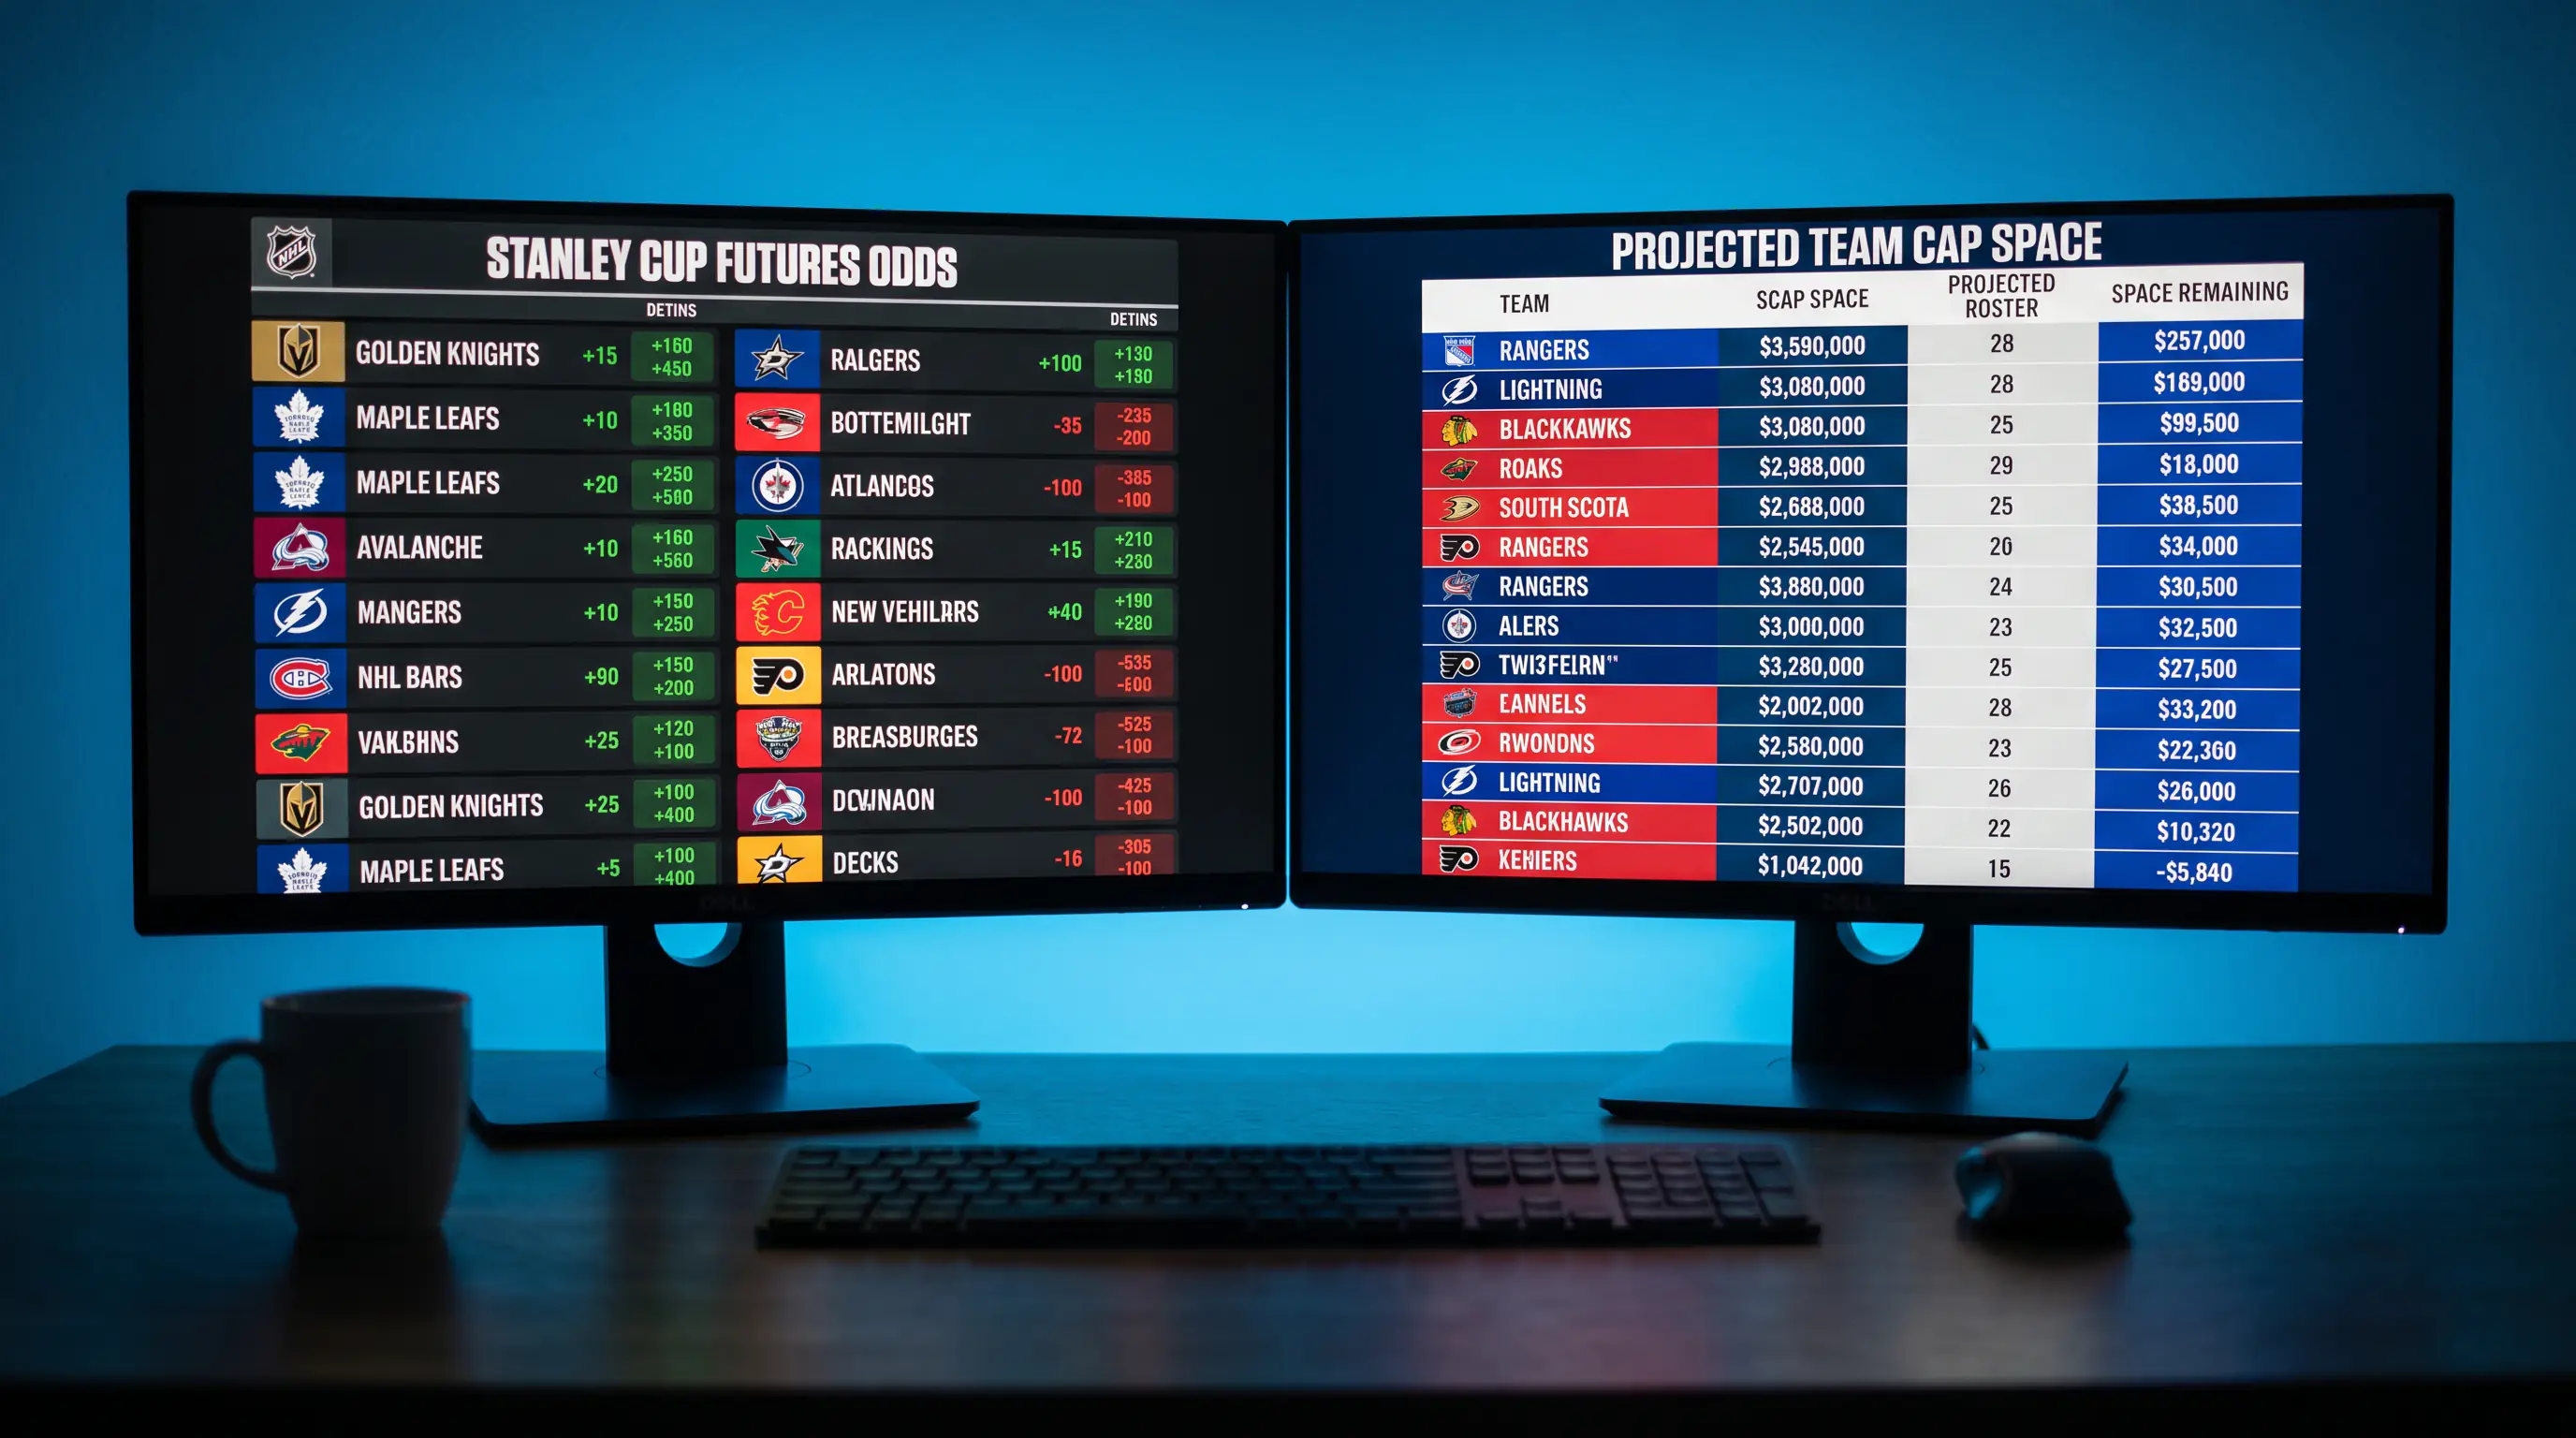
Three years ago, a mid-tier NHL team was priced at 22.00 to win the Stanley Cup. Their roster looked average on paper, but I noticed they had $12 million in projected cap space heading into the trade deadline – more than any other contender. I placed a small futures bet. They made two significant acquisitions in February, their odds plummeted to 8.00 by March, and I cashed out for a tidy profit before the playoffs even started. The play had nothing to do with goals, assists, or save percentages. It was purely a cap space play, and it worked because most bettors do not follow the salary cap at all. The NHL salary cap sits at $95.5 million for 2025-26, heading toward an estimated $104 million in 2026-27 and $113.5 million by 2027-28 – a 25%-plus increase over three years that will reshape competitive balance across the league.
Cap economics are not just background noise for general managers. They are actionable data for bettors. A team’s cap situation determines whether they can add talent at the deadline, retain pending free agents, or even ice their best roster on a nightly basis. Ignoring the cap is like handicapping horse racing without checking the weight assignments.
Where the NHL Cap Is Heading: .5M to 3.5M
The salary cap has been the defining structural force in the NHL since its introduction after the 2004-05 lockout, but the trajectory over the next three years is unusually dramatic. NHL revenue for the 2025-26 season is projected between $7.5 billion and $8 billion, and the cap is directly tied to revenue through the league’s formula. As revenue accelerates – driven by the new Rogers media deal in Canada ($11 billion through 2037-38), the ESPN/TNT rights in the US, and record attendance – the cap ceiling rises with it.
The jump from $95.5 million to $113.5 million over three seasons changes the competitive landscape fundamentally. Teams that were squeezed against the cap – unable to add depth, forced to trade productive players, relying on entry-level contracts to fill roster holes – suddenly have breathing room. Teams that managed their cap well during the flat-cap era now have space to lock up their core players long-term and still add at the margins.
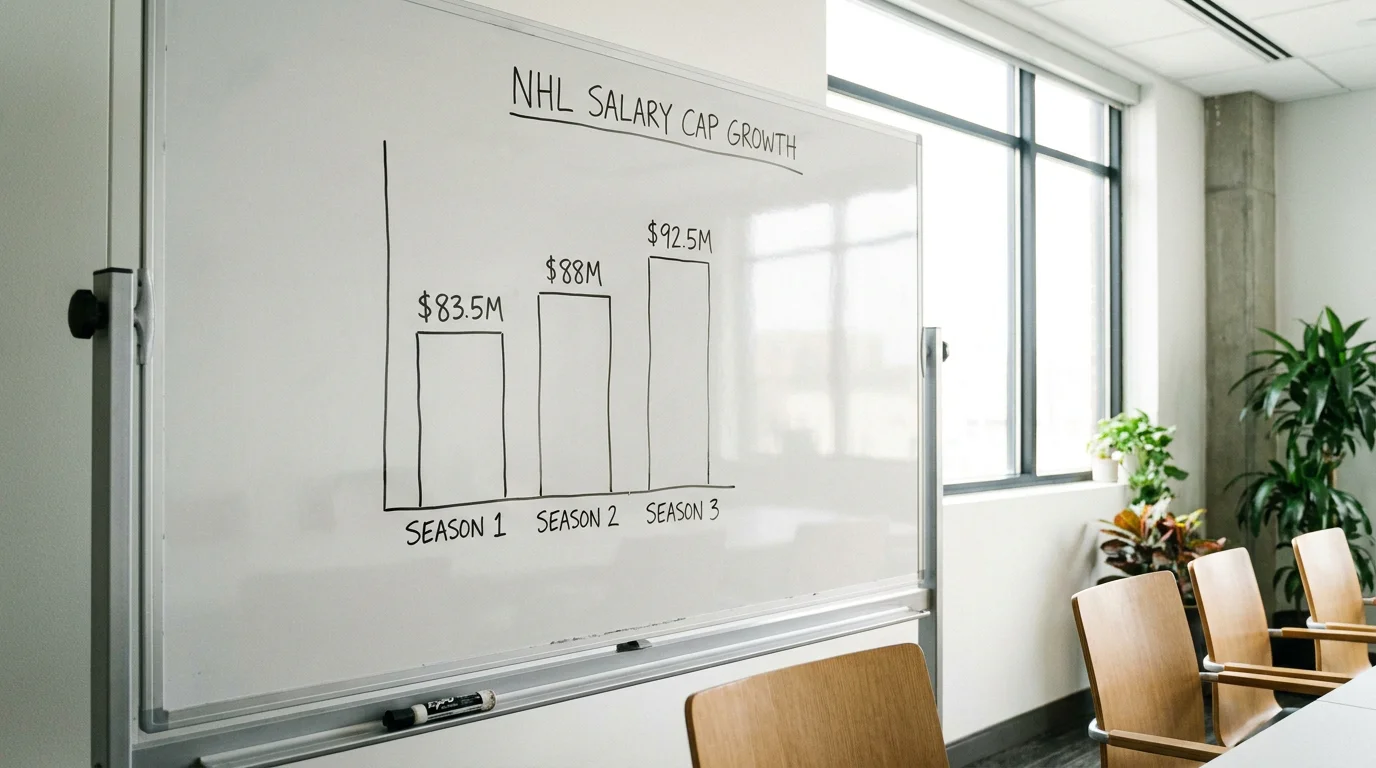
For bettors, the cap trajectory creates two distinct opportunities. First, teams with significant cap space heading into the rising-cap environment can front-load acquisitions, acquiring talent before their competitors have the cap room to compete for the same players. These teams will improve faster than the market expects because their improvement is not dependent on prospects developing or trades working out – it is a direct function of financial capacity. Second, teams locked into long-term contracts at high cap hits will benefit as those contracts represent a shrinking percentage of the total cap. A $10 million contract that consumed 10.5% of the cap in 2025-26 will consume only 8.8% in 2027-28, freeing effective cap space without making a single transaction.
How Cap Pressure Changes Rosters Mid-Season
Every NHL season has a rhythm tied to the cap. Teams open the year with a set roster, but injuries, underperformance, and cap accounting create pressure points that force mid-season adjustments. These adjustments have direct betting implications that the game-day line often fails to capture.
The most visible cap-related roster move is the LTIR (Long-Term Injured Reserve) manoeuvre. When a player goes on LTIR, his cap hit is effectively removed, giving the team space to add a replacement. Some teams strategically place injured players on LTIR to create room for deadline acquisitions, timing the injury recovery to coincide with the trade deadline window. Tracking LTIR usage gives you a leading indicator of which teams are likely to be buyers.
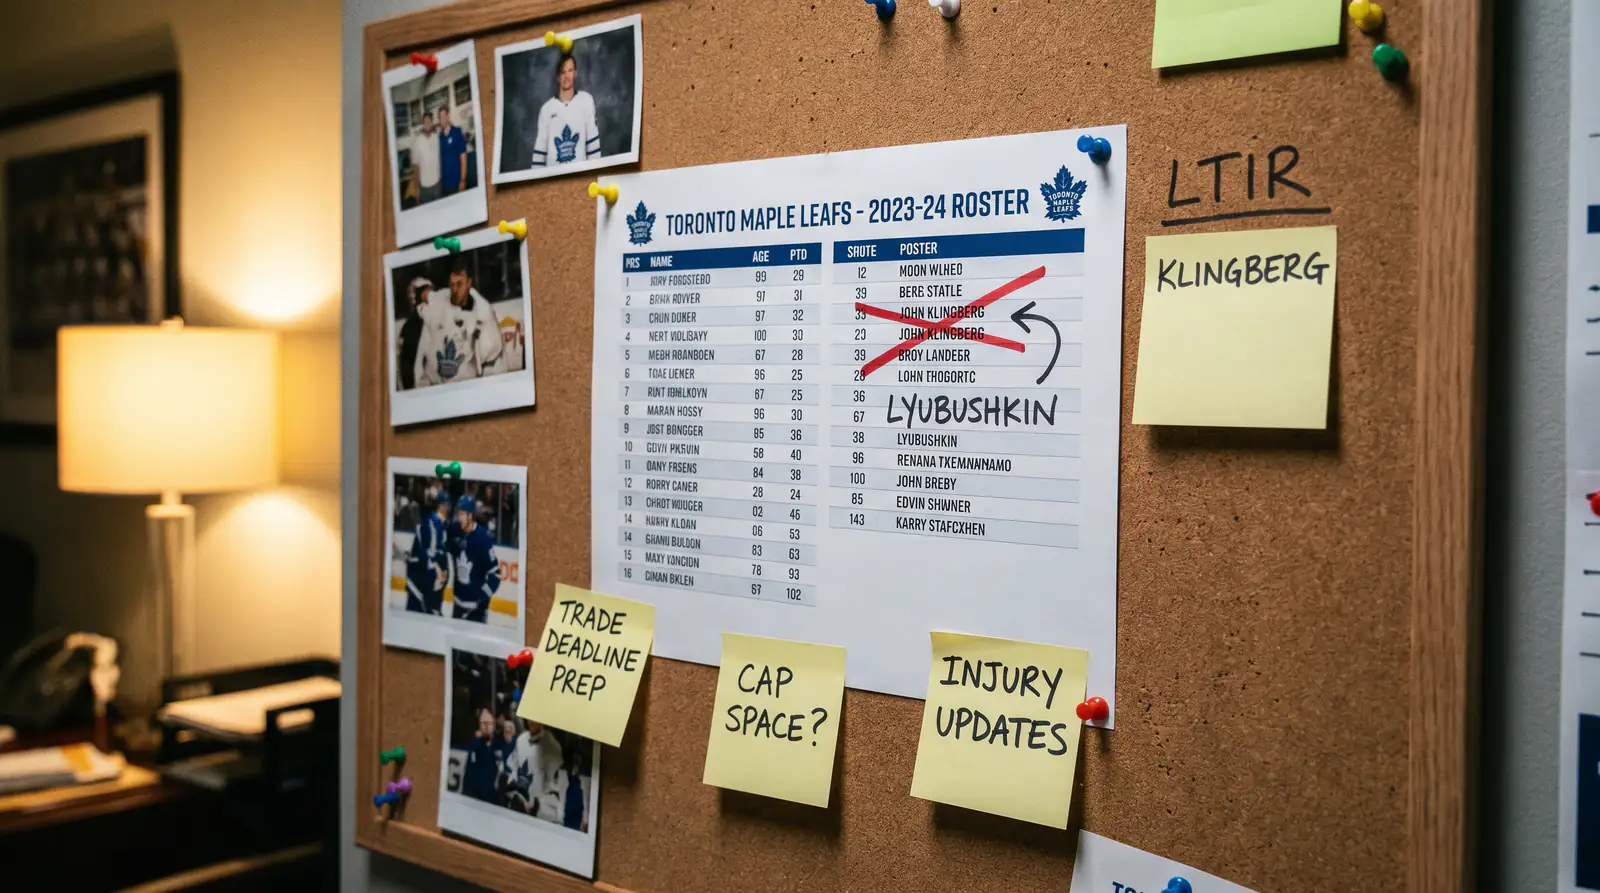
Conversely, teams pressed against the cap with healthy rosters face tough decisions when a player underperforms. They cannot simply call up a replacement from the minor leagues without sending down a player – and sometimes the best player to send down is protected by waiver rules. The result is that cap-constrained teams are slower to adjust their lineup, which creates periods where they are icing a suboptimal roster due to financial constraints rather than talent limitations. Betting against these teams during cap crunch periods is an edge that requires monitoring cap tracking websites but rewards the effort.
The trade deadline is the ultimate expression of cap economics. Buyer teams spend cap space to acquire talent; seller teams shed cap to accumulate draft picks and prospects. The post-deadline period creates a clear competitive bifurcation where buyer teams improve measurably and seller teams degrade. Futures markets adjust to the headline trades, but depth additions and cap manoeuvres that happen quietly in the final 48 hours before the deadline are often underpriced in the line.

Turning Cap Data into Betting Angles
I check cap data at three points during the season: pre-season (to set futures), late January (to identify deadline buyers/sellers), and immediately post-deadline (to reassess team strength). The data is publicly available on several cap tracking sites that update daily.

The pre-season angle is the simplest. Teams with projected cap space above $5 million heading into the season have the flexibility to absorb a bad contract via trade (acquiring a talented player whose team needs to shed salary) or to add depth at the deadline. I cross-reference cap space with the team’s advanced metrics from the previous season. A team that was analytically strong but finished outside the playoffs, and now has cap space to address their weaknesses, is a prime futures target.
The mid-season angle requires more granularity. I look at teams whose cap situation has changed materially since the season started – usually due to LTIR placements, trades, or waiver claims. A team that was cap-neutral in October but now has $8 million in effective space due to LTIR moves is a different proposition at the deadline than their pre-season cap situation suggested. Betting on these teams’ futures before the deadline trades are announced captures value that the market has not yet priced.
The post-deadline angle is the most intuitive but still underexploited. When a buyer team adds two impact players, the futures market reacts to the headline names. But the betting line for their next five games does not always adjust as aggressively, especially if the new players need a game or two to integrate. I find the best value in backing buyer teams starting from their third or fourth game after the deadline, once the new acquisitions are integrated into the lineup and the initial line adjustment has passed.
Salary Cap Betting Questions
How does the NHL salary cap affect futures odds?
The salary cap determines which teams can add talent at the trade deadline, retain key free agents, and build roster depth. Teams with ample cap space heading into the deadline are more likely to improve, which can shorten their futures odds significantly. Tracking cap space alongside team performance data gives bettors a leading indicator of mid-season roster changes that the market has not yet priced.
Where can I find up-to-date NHL salary cap data?
Several dedicated websites track NHL salary cap data in real time, including contract details, projected cap space, buyout scenarios, and LTIR usage for all 32 teams. These sites update daily during the season and are free to access. Searching for NHL cap tracking or NHL contract database will surface the most popular options.
