
 Available in US
Content
Expected Value Separates Profitable Hockey Bettors from Gamblers
There was a point early in my betting career when I was winning 58% of my hockey moneylines but still losing money over a three-month stretch. The numbers did not make sense until I calculated my expected value and realised I was consistently backing favourites at compressed prices where the margin was negative. I was winning bets and losing money – the most dangerous place a bettor can be, because you feel right while going broke. The U.S. national sportsbook hold averaged 10.15% in 2025, meaning the house extracts roughly $10 from every $100 wagered. Expected value is the tool that tells you whether your specific bets are on the right side of that extraction or the wrong side.
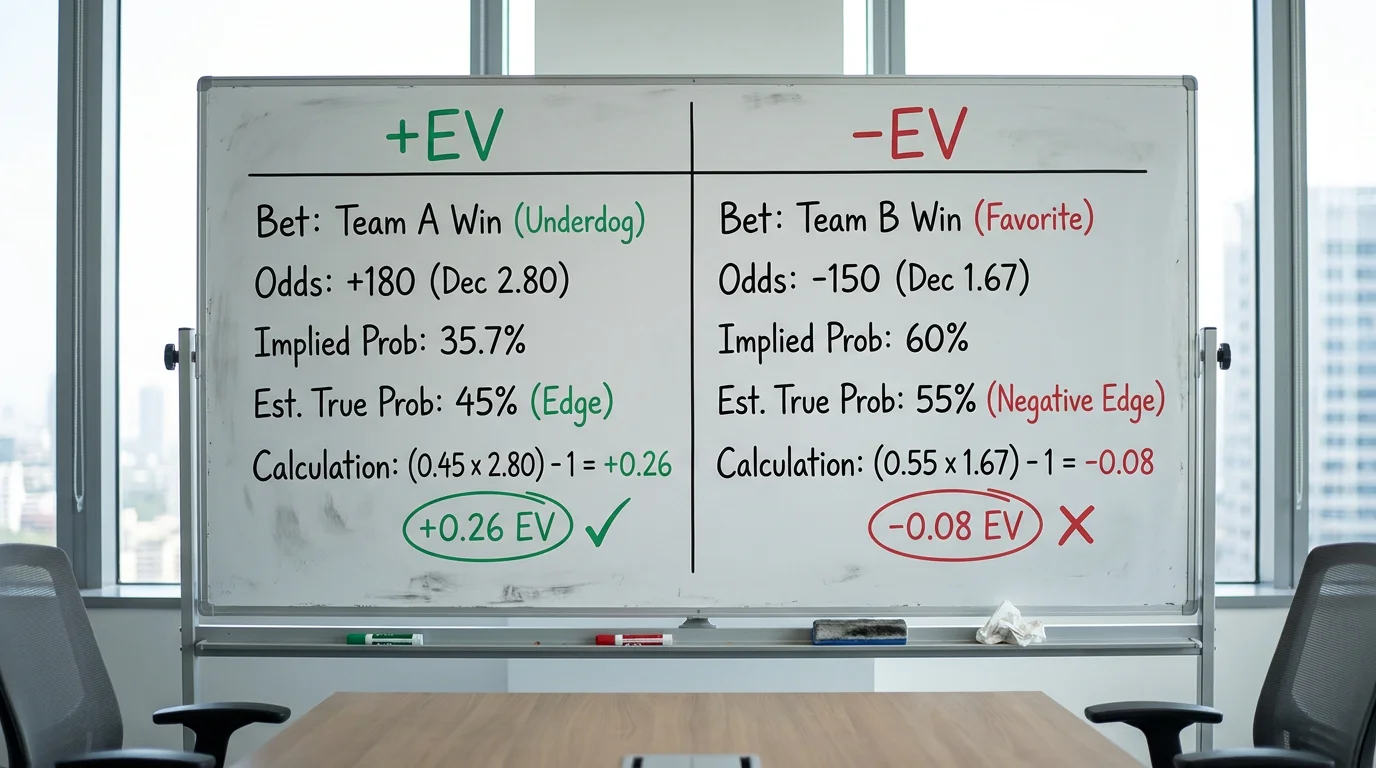
Expected value – EV for short – is the amount you can expect to win or lose per bet over the long run, expressed as a function of your win probability and the odds offered. A positive expected value bet (+EV) is one where the odds are in your favour relative to the true probability. A negative expected value bet (-EV) is one where the bookmaker has the edge. Every profitable bettor in the world, without exception, is placing +EV bets more often than -EV bets. The rest is variance.
The EV Formula Applied to Hockey Markets
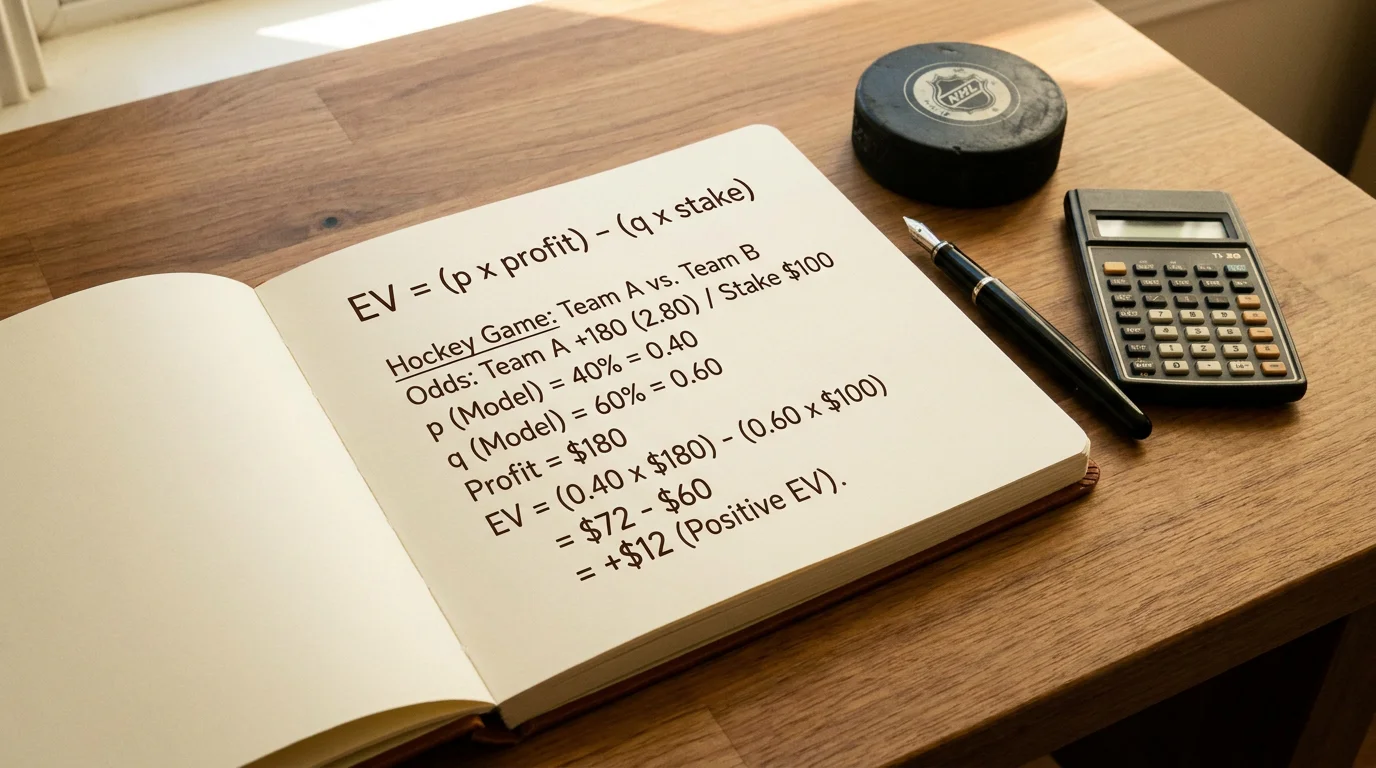
I write the EV formula on every notepad I use for hockey analysis. It is that foundational. Here it is: EV = (probability of winning x profit if win) minus (probability of losing x stake). You can express it as a percentage of stake or as an absolute number. Either way, the formula requires two inputs: the true probability of the outcome and the odds being offered.
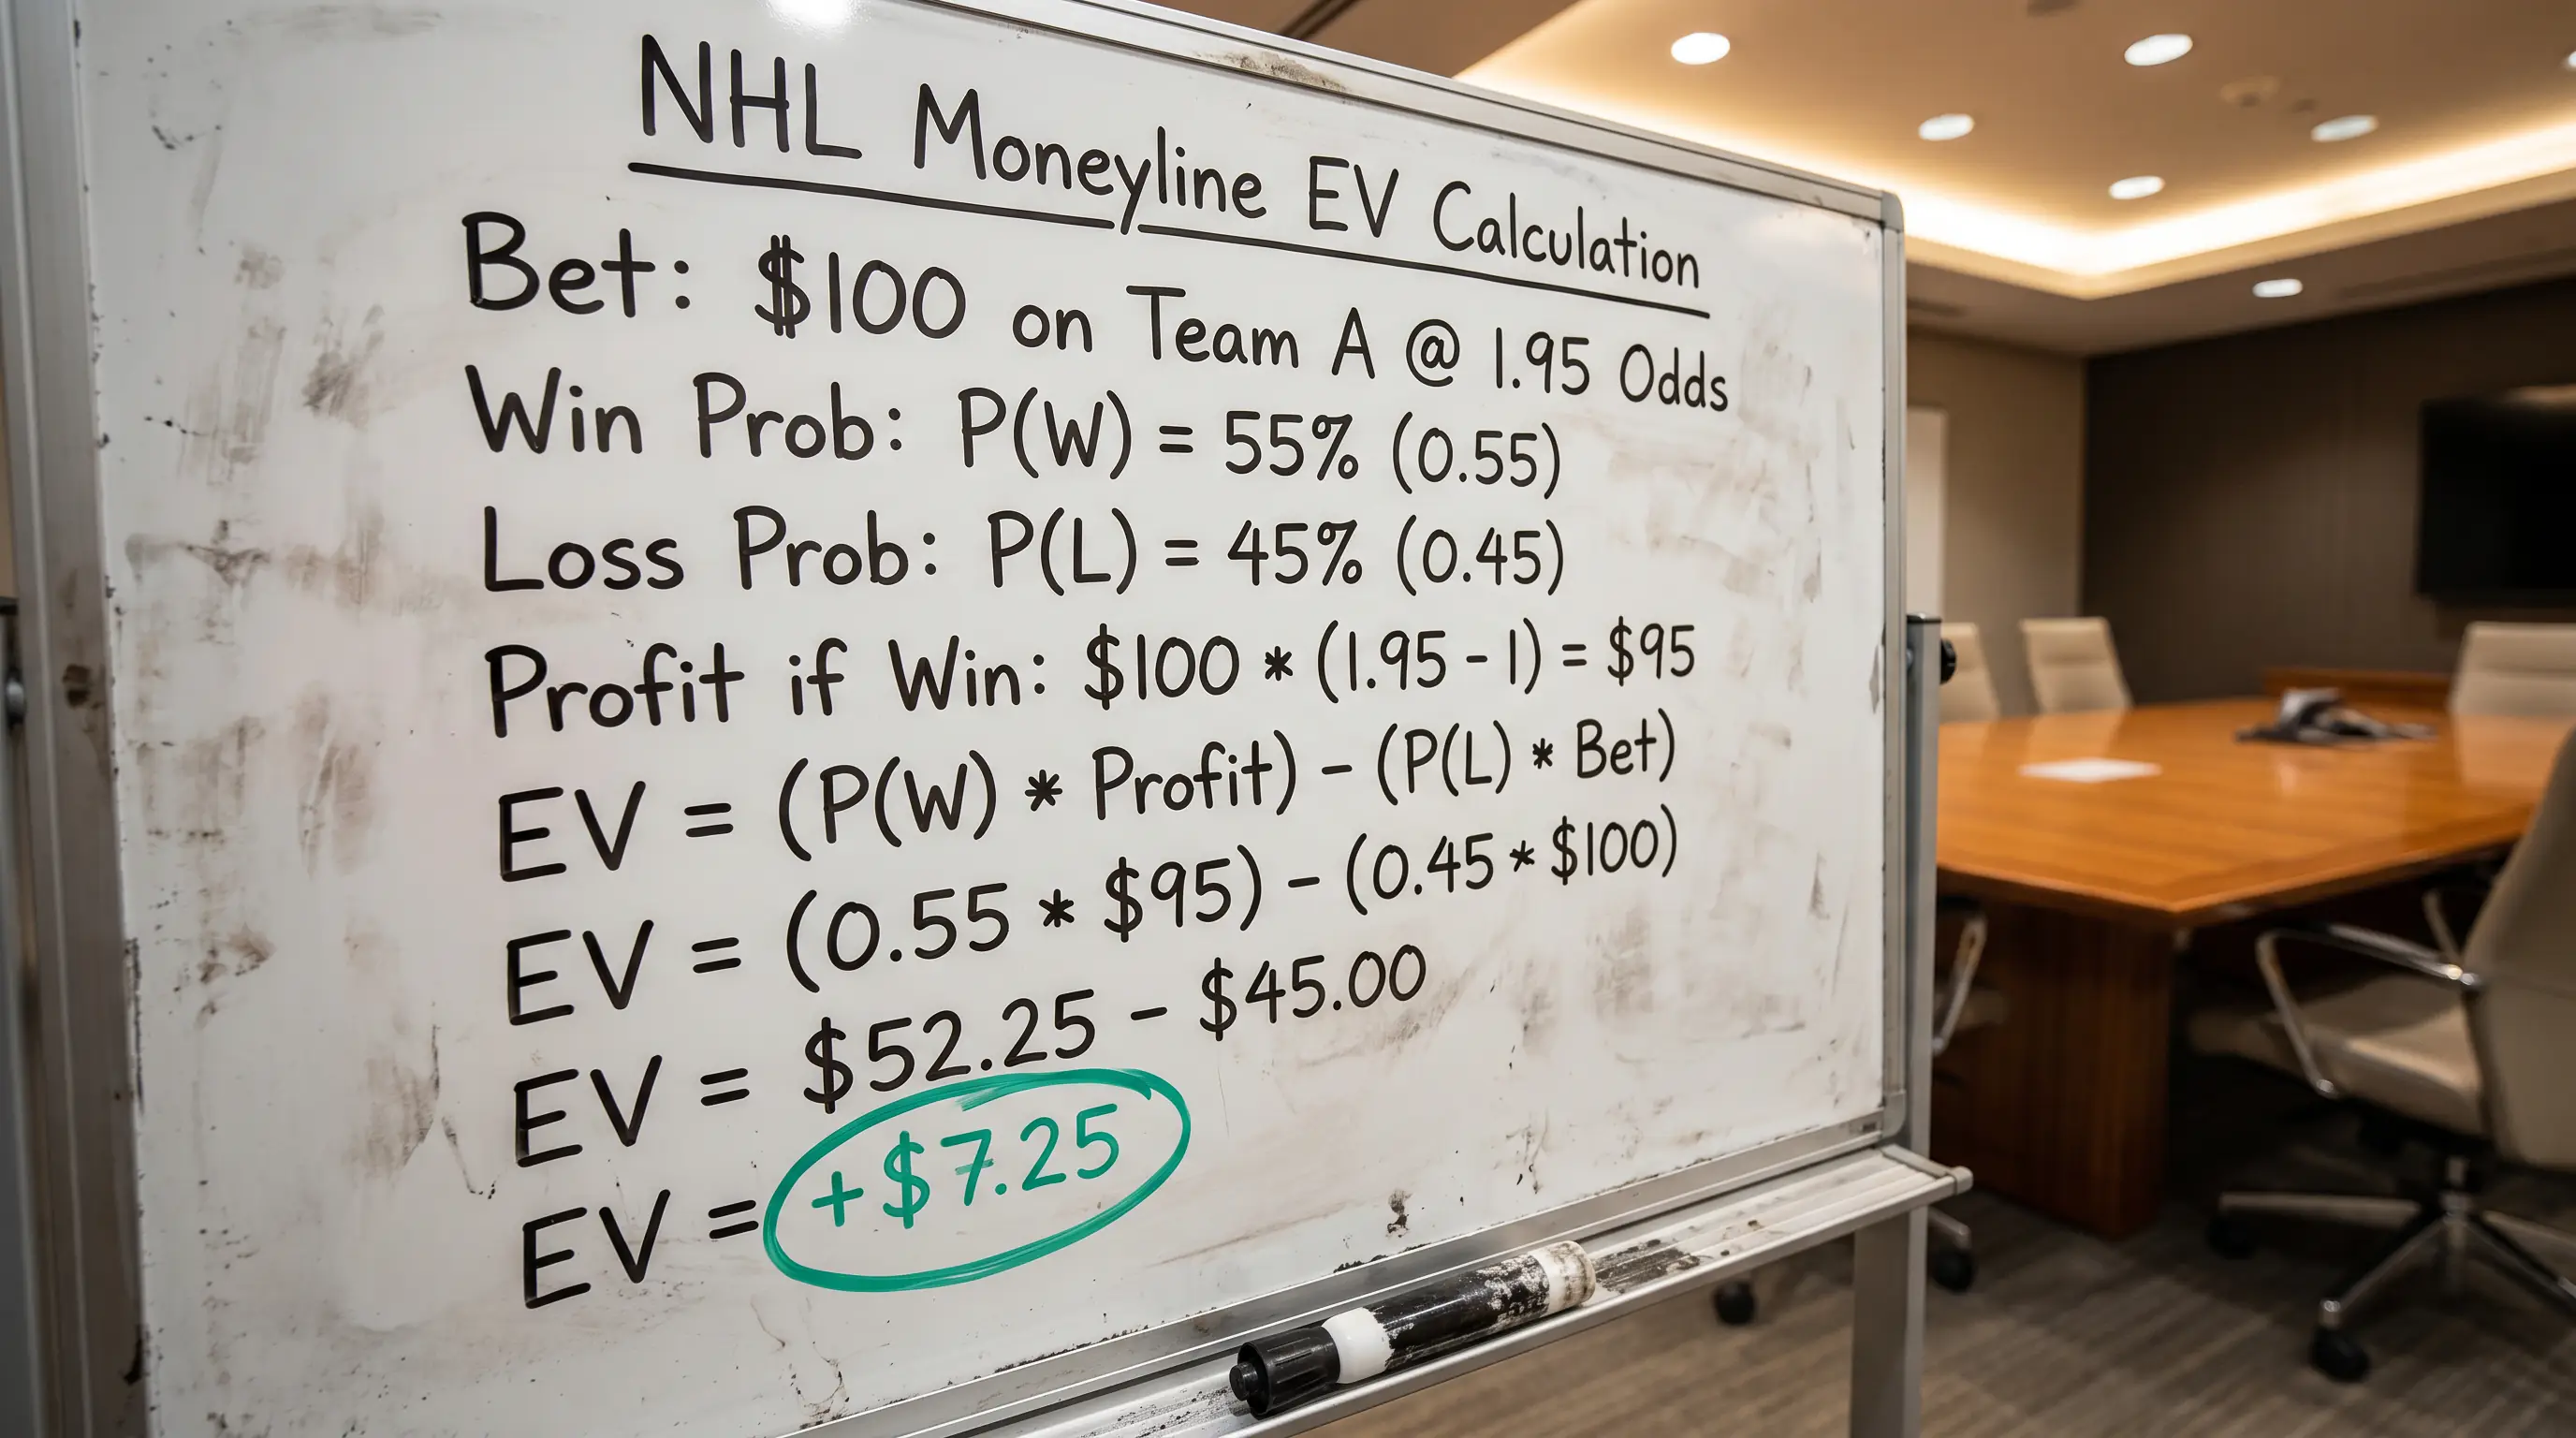
Let’s work through a concrete hockey example. Suppose you estimate that Team A has a 55% chance of winning tonight’s game. The bookmaker offers Team A at 1.95 decimal odds. Your EV calculation looks like this: (0.55 x 0.95) minus (0.45 x 1.00) = 0.5225 minus 0.45 = +0.0725. That means for every pound you stake, you expect to earn 7.25 pence in profit over the long run. That is a strong +EV bet by any standard.
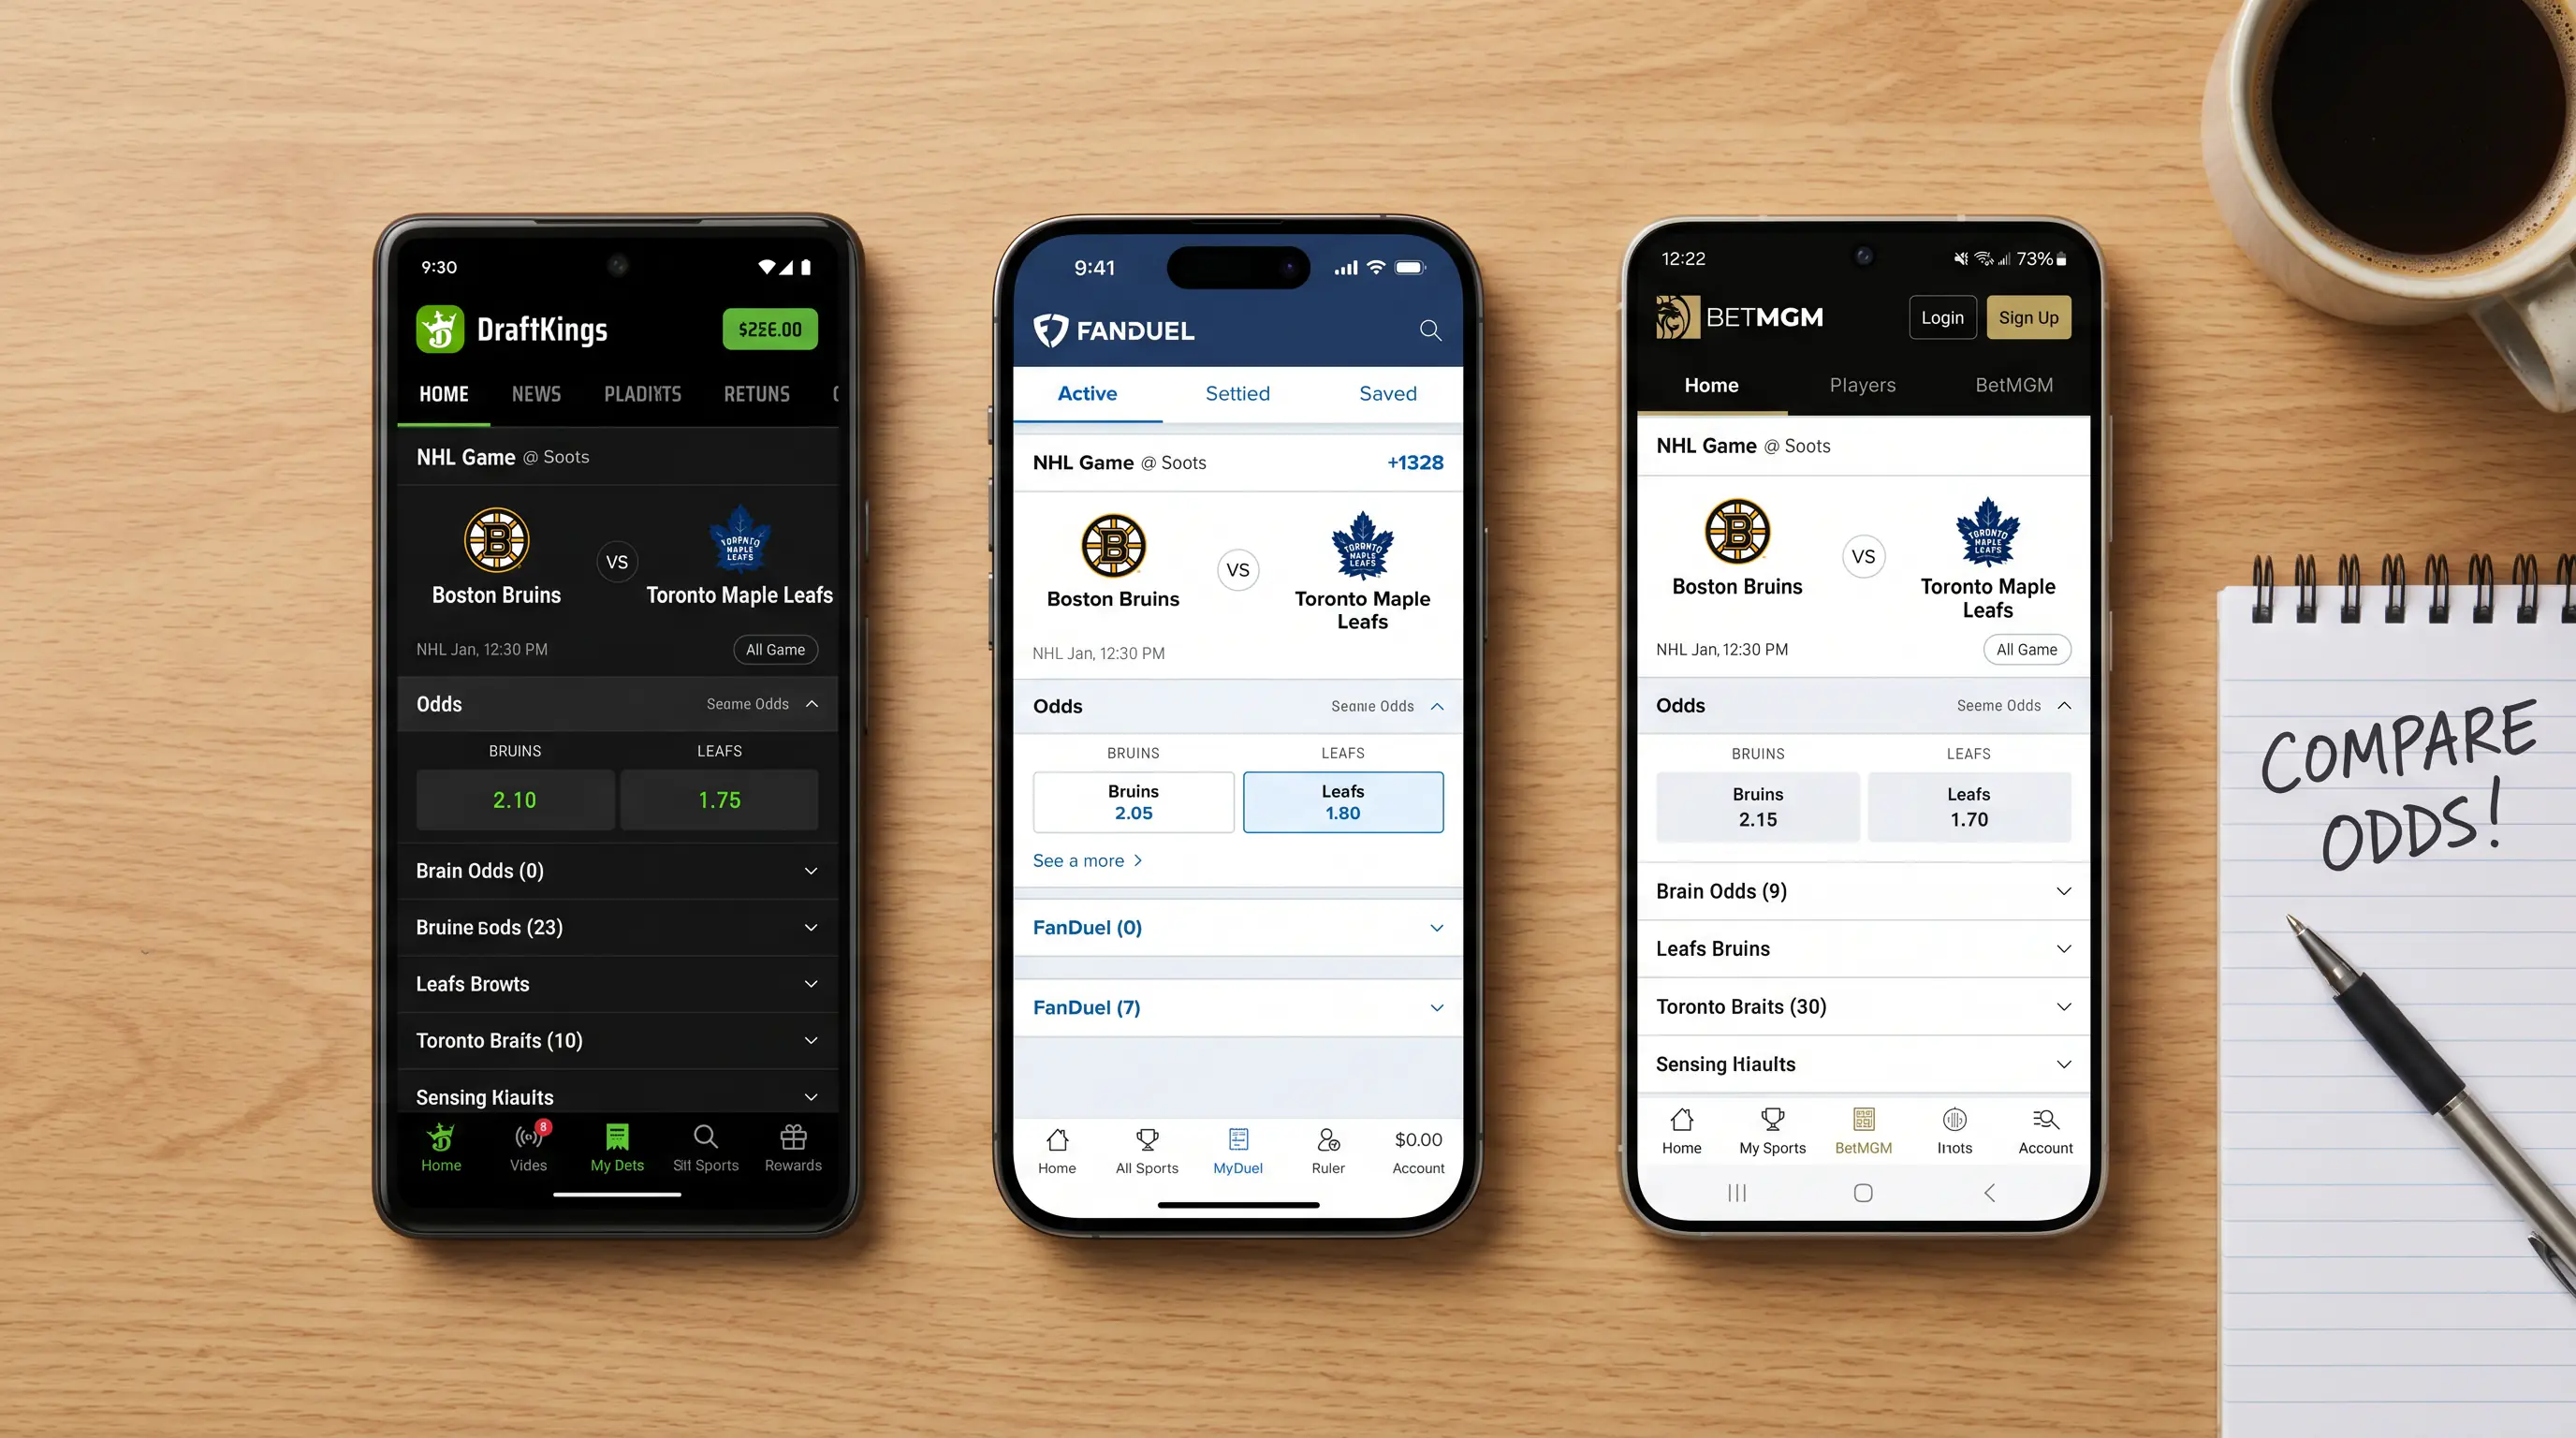
Now flip the scenario. The bookmaker offers Team A at 1.70 instead of 1.95, but your probability estimate stays at 55%. The new EV: (0.55 x 0.70) minus (0.45 x 1.00) = 0.385 minus 0.45 = -0.065. Same team, same probability, different price – and the bet has flipped from +EV to -EV. The sportsbook hold of 10.15% is baked into this kind of line compression, and it is why odds shopping across multiple bookmakers is not a nice-to-have but a mathematical necessity. Even a 10-cent improvement in decimal odds can flip a bet from losing proposition to winning proposition.
The hardest part of the formula is not the maths – it is estimating the true probability. If your estimate is wrong, the EV calculation is meaningless. I build probability estimates using a combination of team-level metrics (expected goals, Corsi, shooting percentage sustainability), goaltender data (recent SV%, quality start percentage), and situational factors (home/away, rest, schedule density). No model is perfect, but a well-constructed model that is right 52-55% of the time on a calibrated basis is sufficient to generate sustained +EV across a season.
Practical Steps to Identify +EV Hockey Bets
Knowing the formula is step one. Applying it systematically across a busy NHL slate is where the work lives. I have refined my process over years of trial and error, and it comes down to four daily steps.
First, I generate my own probability estimates for every game on the slate before looking at any bookmaker’s price. This prevents anchoring bias – the tendency to adjust your estimate toward the posted line rather than forming an independent view. I use a spreadsheet model that takes team-level expected goals, goaltender SV% (weighted toward recent form), and schedule situation as inputs. The output is a win probability for each team.

Second, I compare my probabilities to the implied probabilities embedded in the bookmaker’s odds. NHL underdogs win 39.1% of games outright, which means the line on any given underdog carries an implied probability that may or may not align with the actual upset rate for that specific matchup. If my model says a team has a 42% chance of winning and the bookmaker’s implied probability is 36%, I have a potential +EV spot.
Third, I filter by edge size. I do not bet on anything with less than a 3% estimated edge (the gap between my estimated probability and the break-even probability at the offered odds). Anything below 3% is within my model’s margin of error and is not worth the variance. Above 5% edge, I increase my confidence and potentially my stake. Above 8% edge, I double-check my model inputs because an edge that large usually signals either a genuine opportunity or a mistake in my analysis.

Fourth, I check the line across multiple bookmakers. The best odds on a specific side can vary by 10-15% in implied probability across UK-facing operators. If my betting strategy identifies a +EV opportunity at one bookmaker but the same bet is -EV at another, the difference is the price, not the underlying analysis. Always take the best available price.
Closing Line Value: Your Long-Term Performance Metric
If expected value is the compass, closing line value – CLV – is the scoreboard. CLV measures whether the odds you captured when you placed your bet were better than the closing odds at puck drop. If you bet a team at 2.10 and the line closes at 1.95, you captured positive CLV. If you bet at 2.10 and the line closes at 2.20, you captured negative CLV.
Keith Wachtel, the NHL’s Business President, has spoken about how prediction markets and fan engagement platforms are evolving alongside traditional sportsbooks. As these markets mature, closing lines become increasingly efficient because more information – from sharper bettors, from prediction market data, from public analytics – flows into the line before it closes. Beating an increasingly efficient closing line is harder now than it was five years ago, but it remains the gold standard for measuring betting skill.
I track CLV on every bet. Over the course of a season, my average CLV tells me whether I am genuinely skilled or merely lucky. A bettor with positive average CLV of 2% or more across 500+ bets is almost certainly profitable long-term, regardless of their short-term results. Conversely, a bettor with negative CLV who happens to be up on the season is likely riding variance that will eventually correct.

Calculating CLV is simple: compare your bet odds to the closing odds. I record the closing line from my primary bookmaker at puck drop for every bet I place. Over time, the trend in CLV is the single most reliable indicator of whether my analytical process is working. If my CLV starts declining, I know my edge is eroding before my profit-and-loss statement reflects it. That early warning system has saved me from several extended losing periods that would have been far worse without the course correction.
Expected Value Questions
What is a positive expected value (+EV) bet in hockey?
A +EV bet is one where the odds offered by the bookmaker imply a lower probability than your estimated true probability of the outcome. In practical terms, it means you are getting a better price than the bet is worth. Over hundreds of bets, consistently placing +EV wagers produces profit regardless of short-term variance.
How do I track my closing line value across NHL bets?
Record the odds at which you place each bet and the closing odds at puck drop from the same bookmaker. Calculate the implied probability of both prices and compare them. If your bet price implies a lower probability than the closing price, you captured positive CLV. Track this across all bets over a season to assess the quality of your process.
